
Today’s marketer is data-driven. More than simply connecting our clients with their data, Kochava seeks to empower strategic decisions through marketing intelligence. Our growing Client Analytics team is comprised of data analysts who work hand-in-hand with clients, delivering face-to-face business value assessments (BVAs) and quarterly business reviews (QBRs) that inform, educate and empower UA managers, CMOs and other decision makers to position their brands for success.
In this series, members of our Client Analytics team will explore marketing intelligence insights available to our customers from the tools Kochava provides.
Targeting new users effectively is every marketer’s daily challenge. User acquisition or growth managers are tasked with reaching new high-quality users and that job doesn’t end when users install the app. Although people are spending more time on mobile devices, because of its overstimulated environment, retention drastically decreases with time, regardless of the vertical.
Without knowing, you may be mistargeting with irrelevant messaging or expending valuable ad spend on a less optimal segment. To reach high-quality users, revisiting your audience data and considering different ways to analyze it will shed light on better ways to target, and assessing app engagement is a great place to start.
How can you target more effectively? The One-and-Done analysis of user engagement
How a marketer determines engagement differs widely and is based on a variety of factors and nuances, such as the app vertical, how the app monetizes, and other variables. To help distinguish the different types of users in an audience, the Kochava Client Analytics team has a simple, customizable query called the One-and-Done analysis.
What is the One-and-Done analysis?
The One-and-Done analysis is a versatile SQL script that helps measure the quality of users where quality is the percentage of users who complete an event. The analysis can help you segment users under three classifications based on actions performed during a specified time frame:
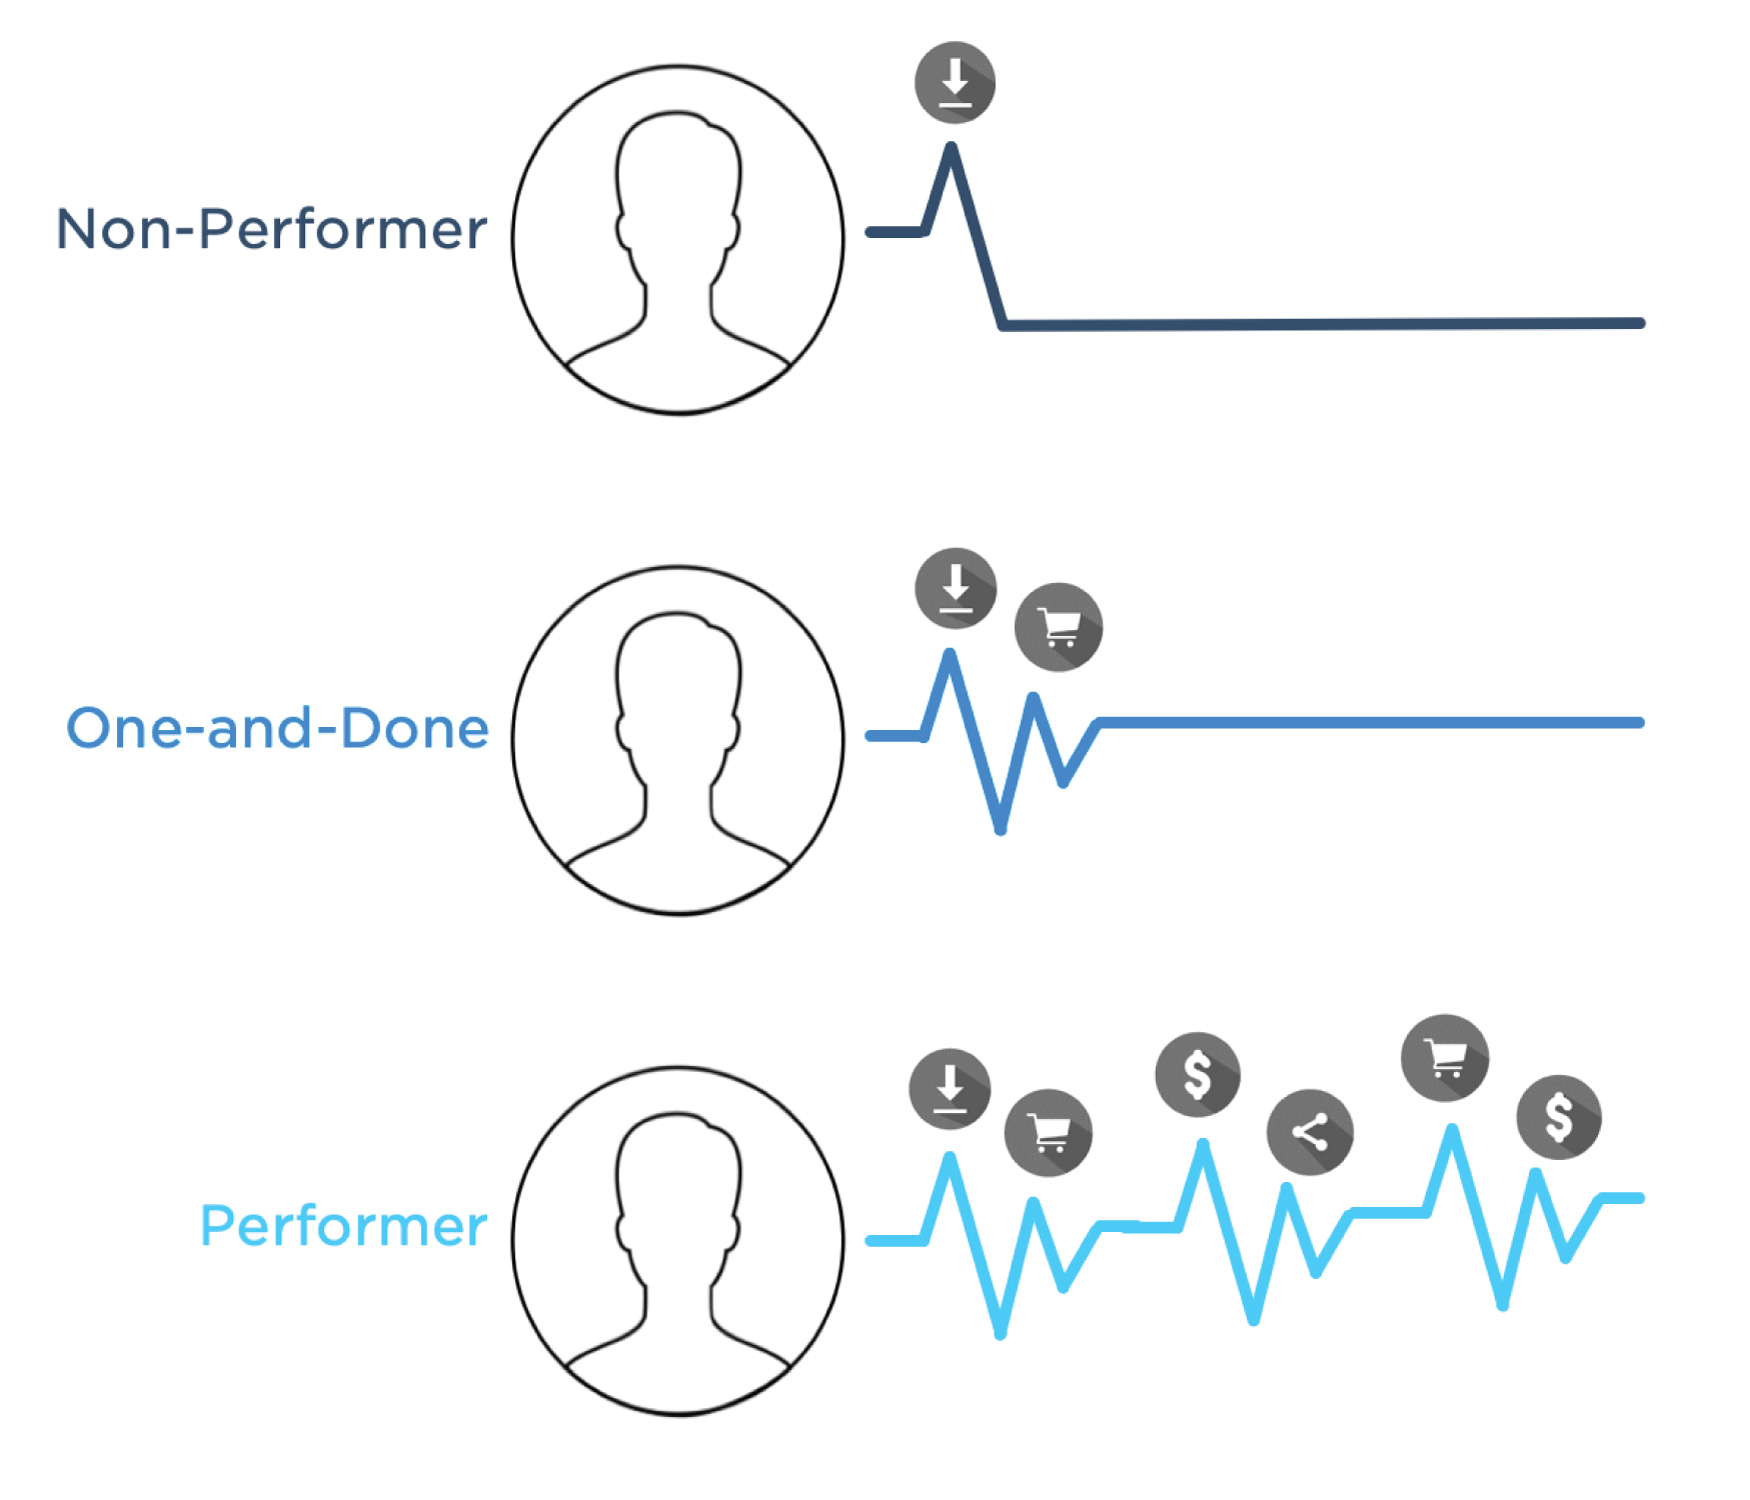
- The Non-Performer
- User installs the app and then disappears without completing a KPI
- The One-and-Done
-
- User installs the app and performs one post-install action but never returns
- The Performer
-
- User installs the app and performs consistently through regular engagement with KPIs
You can determine which KPIs to evaluate, the specific time frame of installs, and when the post-install events occurred. Then, use the Query tool to write SQL scripts to analyze, cohort, group, slice, dice, and pivot your data in unique, customized ways. Or, the Kochava team can help you customize the query for your specific brand’s needs.
In addition, measuring ad partners by how many users are classified as “one-and-done” is beneficial in comparing user quality by media partner. Partners that heavily over-index in one-and-done users can be trimmed or eliminated, whereas partners with the lowest percentages can be prioritized.
The potency of this analysis can be further increased by making sure the app is measuring a healthy mix of KPIs throughout the user funnel. See Post Install Event Examples for a list of recommended events to track by app vertical.
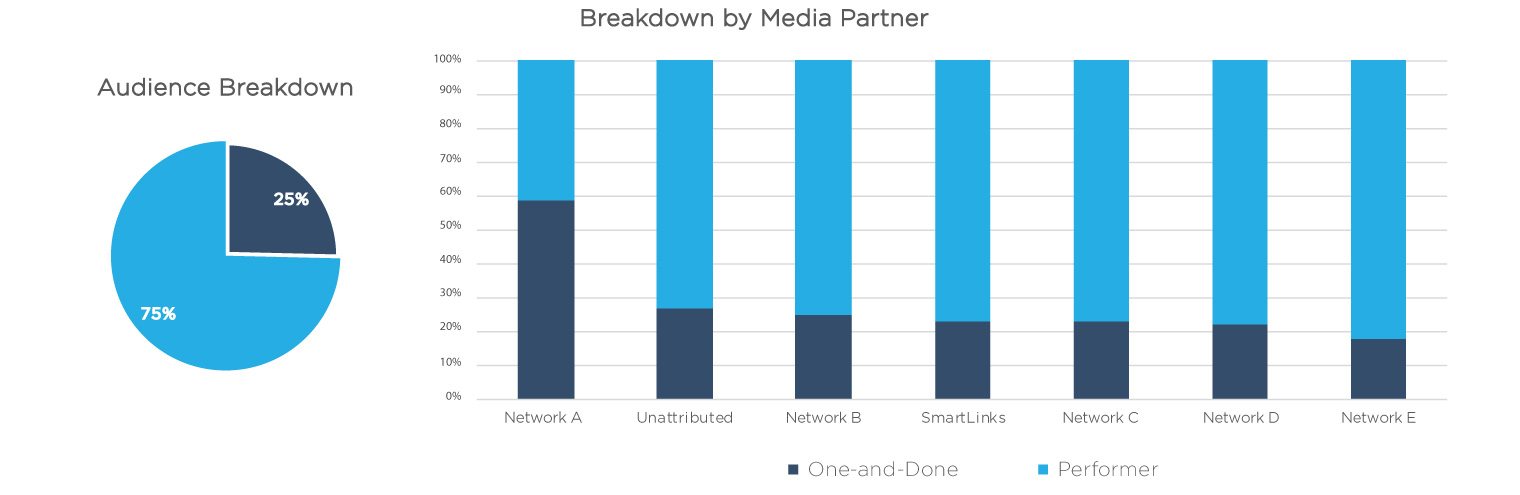
Below is an example of how you can visualize the data from the query to help distinguish the one-and-done vs. performer segments by media partner, providing insight into which partners drove quality user engagement.
Sample use case
A financial service provider specializing in money transfers has a goal to increase this conversion event and are exploring ways to grow their user base. In seeking assistance from the Client Analytics team at Kochava, they learned that a percentage of their converted users were “one-and-done.” Additionally, they learned which media partners repeatedly delivered this user type. They can now apply their learnings toward their next campaign by removing certain media partners and creating a lookalike campaign of their newly segmented performing users.
How can you apply the One-and-Done Analysis results?
There are a couple of ways in which you can apply your learnings from the One-and-Done analysis to grow your audience:
Audience Targeting: Use your performers as a seed for a lookalike model. Activate a campaign with the lookalike audience to acquire more users with attributes that commonly define performers, getting stronger ROI on your acquisition efforts.
Push Engagement: If your goal is to retain the one-and done user, load this audience segment into your push provider platform for a push, in-app message or SMS campaign to reengage them with a contextually relevant offer.
Marketers can also export a list of device IDs by segment and activate them with a preferred media partner.
Grow your audience with the One-and-Done analysis
While you may already be segmenting your audience, the One-and-Done analysis brings highly customizable and flexible turnkey segmenting. If you haven’t identified and segmented one-and-done users, you are probably mistakenly considering them active performers.
If you are looking for greater insight into the quality of installs, the One-and-Done analysis may be a solution to explore. The output is easy to understand and can be automated on an ongoing basis to provide actionable audience segments.
Interested in refined and customizable user segmentation? Contact your client success manager or support@kochava.com.
Not a Kochava customer? Contact Us Today.

Kochava