How to eliminate overattribution and redundant spend
TL;DR Summary
Modern mobile marketers face significant inefficiencies from overattribution and redundant ad spend, wherein multiple networks claim credit for the same conversions, inflating reported installs far beyond actual new customers. With Google dominating mobile attributions and self-attributing networks operating as black boxes, marketers must prioritize unique reach, genuine user quality, and continuous efficiency monitoring for effective media mix optimization… (click to expand)
Effective optimization involves analyzing multi-touch influencer overlap to eliminate duplicated reach and spend inefficiencies, focusing on ongoing user value (e.g., paid memberships, engagement) over mere install volume and proactively identifying data anomalies such as unusually high click-to-install ratios. Building a robust measurement infrastructure is crucial to ensure that every marketing dollar generates tangible customer value.
The Attribution Paradox
It’s Tuesday morning coffee hour around a major brand’s marketing dashboard. The CMO reviews 30-day performance: 6.2 million app installs, a 12% increase from the previous quarter. The media team celebrates. But hiding in plain sight within a spreadsheet no one wants to examine too closely lies an uncomfortable truth: 67% of these “new customers” were touched by three or more networks—each claiming full credit for the conversion.

This is the reality of modern mobile marketing, where attribution has seemingly become less about measurement and more about arbitration. According to Q1 2025 data from Kochava, Google Ads properties now capture 70% of all mobile conversion attributions, up from 63% just one year ago. Google, a self-attributing network (SAN) like other large platforms such as Meta and Apple Ads, does not report all click and impression interactions to measurement partners, complicating mutli-touch attribution analyses.
When an app marketer’s media mix combines multiple SANs amid other ad networks and DSPs, the challenge isn’t just overlap in reach—it’s that this overlap can create a cascading inefficiency throughout your entire media mix.
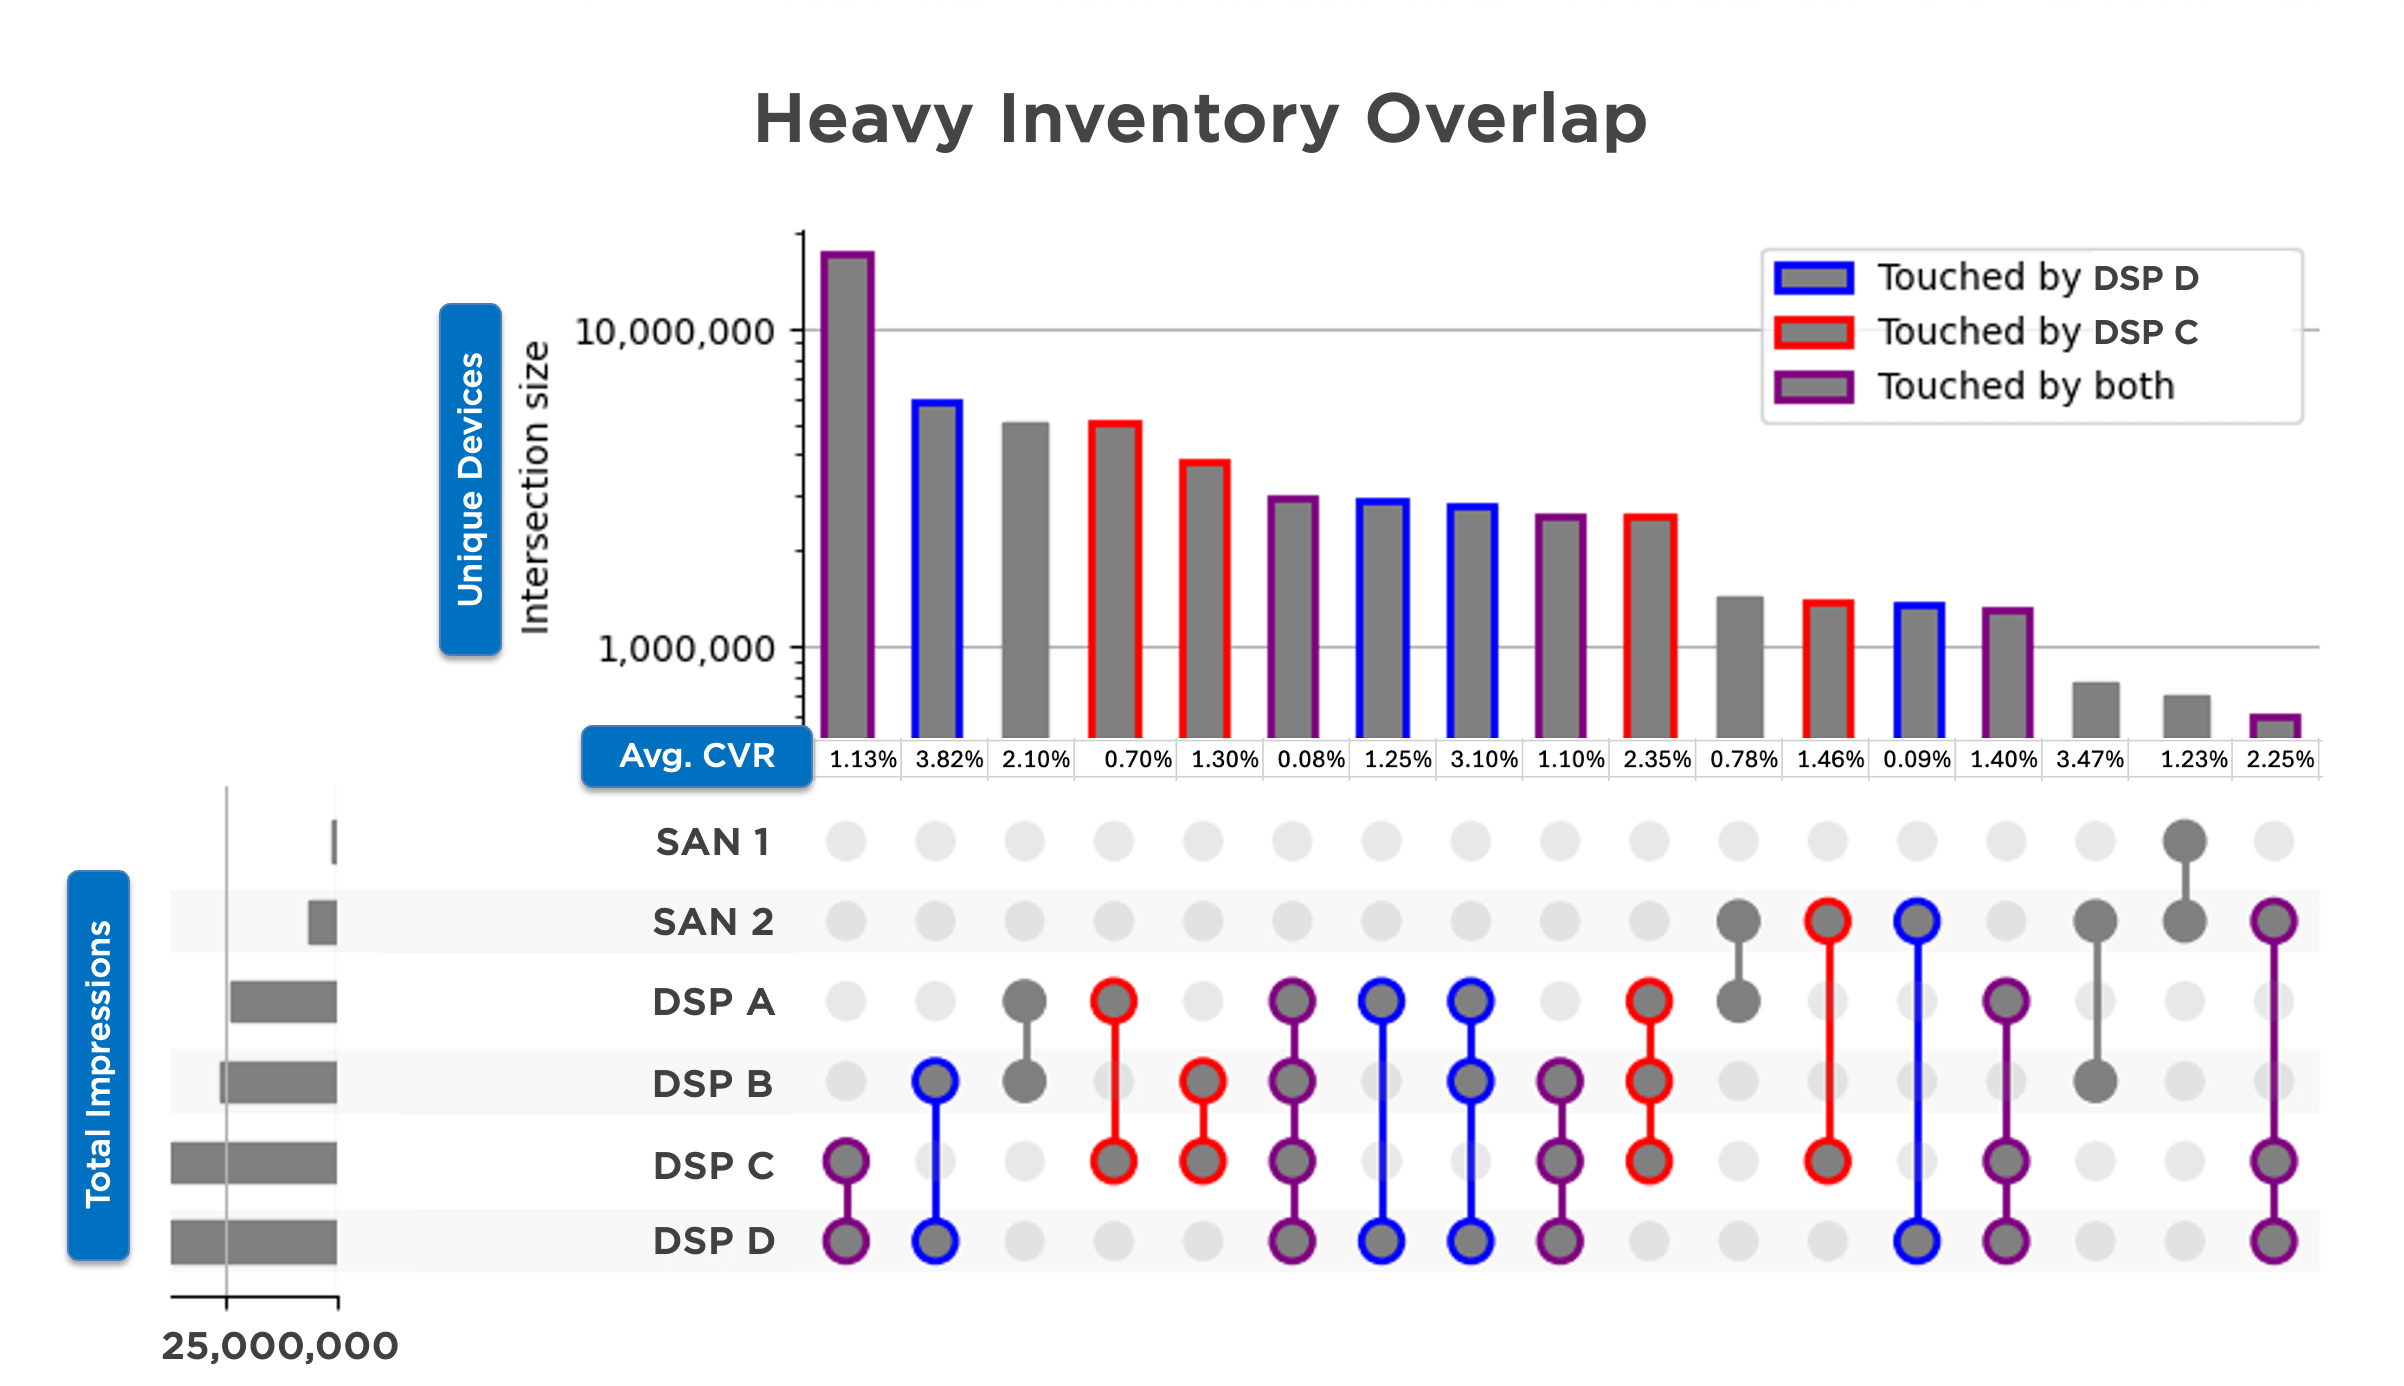
To illustrate, here’s an analysis of a QSR Android app where DSPs C and D—and to a lesser extent DSP A—reach nearly identical inventory. While each of these overlapping groupings might exhibit different conversion rates and performance outcomes, they often share the same sub-publishers. This can lead to self-bidding in programmatic environments. In winner-takes-all attribution, identifying the “true winner” among these overlaps becomes challenging.
The path forward requires a fundamental shift in how we approach media mix optimization—from managing partners to managing outcomes, from counting conversions to understanding incrementality and unique reach.
Tip 1: Maximize Unique Reach by Trimming Overlap
The first step is understanding where your media dollars are actually going vs. where your partners claim they’re going. Multi-touch influencer overlap analysis reveals patterns that transform how you should allocate budget.
Consider the data from a recent QSR app analysis presented in our recent webinar Campaign Optimization Masterclass: Navigating Quality, Reach & Frequency in Complex Media Mixes: AppLovin and ironSource were reaching nearly identical users, with both networks touching the same inventory segments in the vast majority of total conversions—and where they overlapped, conversion rates varied dramatically within each cohort, suggesting that one partner was consistently more effective despite reaching the same audience.
The Real Cost of Redundant Reach
The solution requires three specific actions:
Action 1
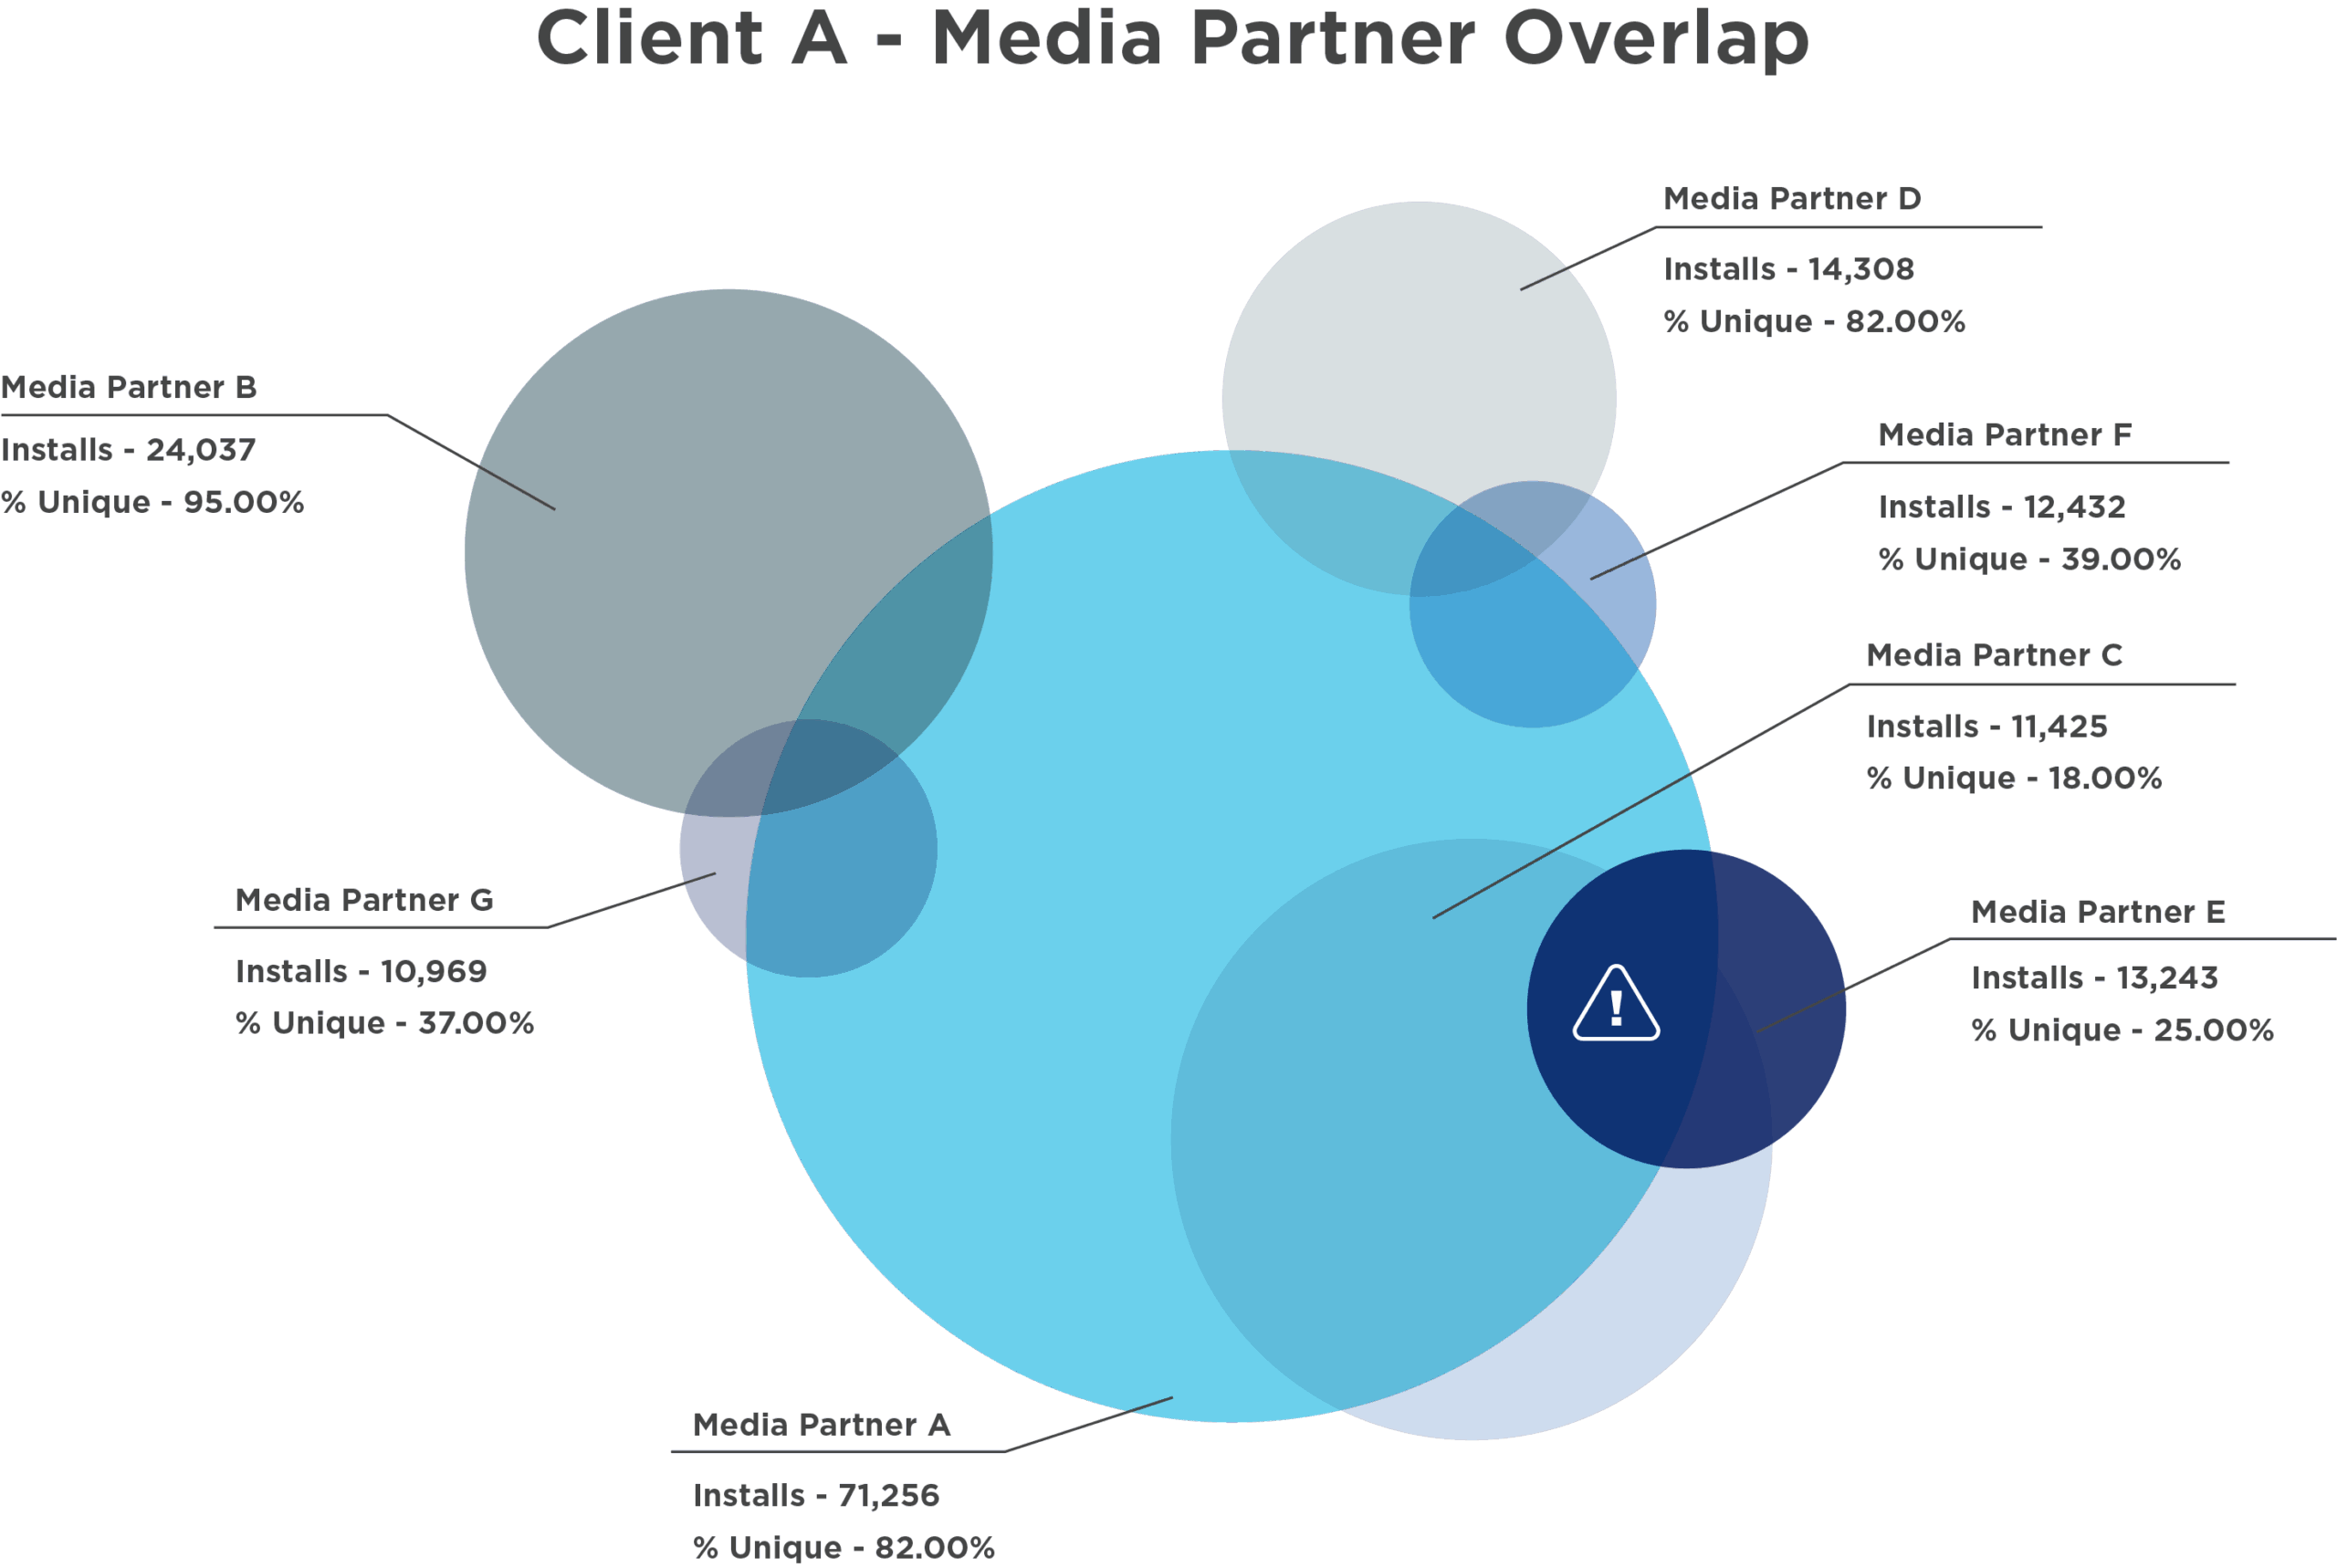
Prioritize media partners with high percentages of unique installs for broader audience coverage. This means championing incremental reach over total volume. According to our Kochava Foundry analyses, some partners deliver 82% unique reach while others struggle to break 18%, despite claiming similar conversion volumes.
Action 2
Implement multi-touch influencer overlap analysis to quantify where multiple networks reach the same users. The data often reveals that your “diverse” media mix is actually three or four networks competing for the same narrow audience segment.
From Overlap Analysis to Budget Action
Action 3
Routinely reallocate spend away from overlap-heavy sources. This doesn’t mean summarily eliminating partners, but rather right-sizing investments based on unique contribution. A network delivering 100,000 installs with 82% uniqueness is far more valuable than one delivering 200,000 installs with 18% uniqueness, even if the latter appears more successful in platform-reported metrics. Understanding uniqueness is essential for survival.

“If you take nothing else away, care about a network’s unique quality. It’s the quality within that unique bucket that really separates the dogs from the runners.”
Grant Simmons, VP, Kochava Foundry in Campaign Optimization Masterclass: Navigating Quality, Reach & Frequency in Complex Media Mixes
For more information on streamlining overlapping reach, check out How to Avoid an Overcrowded Media Mix.
Measurement Architecture
Executing overlap analysis requires granular mobile measurement partner (MMP) data to track multi-touch journeys across all partners. While attribution shows the last-touch winner, marketing mix modeling (MMM) quantifies each touchpoint’s incremental contribution—revealing which “losing” impressions actually drive value upstream.
Tip 2: Optimize for Quality—Not Just Volume
Volume without value is organizational theater—impressive to watch, expensive to produce, ultimately meaningless.
When Premium Price Means Better Value
A streaming app case study from one of our Kochava Foundry analyses illuminates this. We found that for this particular app, baseline paid membership rate was 9.2% within a 10-day window—but varied dramatically by source. While Google Display generated 231K attributed installs, deeper analysis revealed a quality index of just 65—meaning these users were 35% less likely to convert to paid memberships than average.
Meanwhile, Reddit, with a $9.38 cost per install (CPI) and a fraction of the volume, delivered users with a quality index of 225. Those “expensive” Reddit users were worth more than double in terms of downstream value. Such quality disparity extends across the network mix. YouTube showed an 87% higher likelihood of generating paid memberships (quality index of 187) despite lower volume.
Building Your Quality Framework
To optimize for quality, establish clear tracking for post-install events—paid memberships, key engagement milestones, retention markers—that indicate actual customer value. Then implement weighted CPI calculations using quality indices. A network delivering installs at $3 CPI with a quality index of 150 is actually more cost-effective than one delivering at $2 CPI with a quality index of 75.
Reward unique, high-quality partner performance with increased budget allocation. Deprioritize those delivering high overlap or low engagement.
Measurement Architecture
Quality optimization demands robust post-install event tracking from your MMP—registrations, purchases, retention milestones. Layer in MMM analysis to understand true lifetime value patterns across sources, moving beyond simple install costs to revenue-based decision-making.
Tip 3: Enforce Continuous Efficiency & Fraud Monitoring
Trust in digital advertising is earned in milliseconds and lost in spreadsheets. When click-to-install ratios reach 400:1, you’re not looking at a conversion funnel—but a data anomaly demanding investigation.
Red Flags
Continuous efficiency monitoring is key to maintaining system integrity. We’ve found that the typical click-to-install ratio averages around 15:1—some come down to 5, some go up to 30. But it’s not 400. You’re not dropping 400 people into your app store and only 1 is installing.
Deploy efficiency and fraud monitoring reports on an ongoing basis, not just quarterly. Include click-through rate (CTR) and click-to-install (CTI) ratios as baseline metrics. When you identify outliers—and you will—your response should be immediate and collaborative.
Make Monitoring Collaborative, Not Combative
Flag and challenge outlier performance patterns systematically. Networks showing unnatural conversion curves or suspicious clustering patterns need to explain their data. This doesn’t have to be antagonistic—it can be a really good conversation because ultimately, they too want to market as well as they can.
Most importantly, tie partner evaluation and ongoing campaign spend to transparent, justifiable conversion reporting. Make it clear that traffic quality and data transparency are nonnegotiable. Partners should be willing to send impressions separately from clicks and transparently pass publisher site IDs.
The distinction between uppercase and lowercase fraud matters here. Uppercase Fraud is malicious intent. Lowercase fraud is systemic inefficiency masquerading as performance. Both cost you money, but the latter is far more common and fortunately easier to fix through proper monitoring and partner communication.
Measurement Architecture
Real-time efficiency monitoring runs on MMP data streams, with advanced fraud detection capabilities flagging anomalies as they occur. Marketers leveraging Kochava as their MMP are encouraged to activate the full strength of Kochava Fraud Prevention. MMM can provide a strategic validation layer—confirming whether any suspicious patterns actually impact business outcomes or are just noise in the signal.
The Path Forward: Measurement as Strategy
Media mix optimization doesn’t necessitate finding perfect attribution, but accepting imperfection while demanding transparency. With SANs controlling their own narratives and Google’s dominance approaching imperial levels, the answer is to understand the ins and outs of the system well enough to use it effectively.
The data tells a clear story: Most advertisers overpay for redundant reach while simultaneously missing unique audiences that could transform their business. Significant overlap exists across partners, with quality indices varying dramatically. You can turn this inefficiency into opportunity!
Ready to dive deeper into advanced optimization strategies?
Access the full webinar: Campaign Optimization Masterclass: Navigating Quality, Reach & Frequency in Complex Media Mixes
Learn how multi-touch influencer analysis, uniqueness measurement, and frequency capping can transform campaign effectiveness. Drill into optimization tactics for omnichannel strategies—using performance breakdowns and quality index metrics to balance incrementality, avoid overattribution, and reduce network overlap.
Strategic Measurement Imperative
The recommendation is clear: Build your measurement infrastructure before you need it. Establish quality metrics that matter to your business. Monitor efficiency continuously, not periodically. And most importantly, recognize that in a world where every platform claims victory, the truth that matters is the one that shows up in your revenue.
The marketer who succeeds in 2025 and beyond won’t be the one who spends the most or partners with everyone. The winner will have understood that true optimization begins not with adding more and more and more, but with leveraging what you already have—and having the marketing moxie to act accordingly.
Because ultimately, the best optimized media mix isn’t the one with the most sophisticated attribution model or largest number of partners. It’s the one where every dollar you spend has a clear purpose, every partner has a defined role, and every claimed conversion can be traced to an actual customer generating actual value.
Navigate Your Media Mix With Expert Guidance
Truly optimizing your media mix requires advanced measurement infrastructure and deep analytical expertise. Our strategic consultants at Kochava Foundry have conducted hundreds of media mix optimization analyses that include partner overlap analyses, efficiency audits, and cross-device attribution studies. Let us help you build the measurement architecture that turns attribution chaos into competitive advantage. Request a free consultation with the Foundry Team today!
Optimizing Your Media Mix FAQ
What is attribution overlap and why is it a significant problem in mobile marketing?
Attribution overlap occurs when multiple advertising networks claim credit for the same conversion or app install, leading to inflated reported numbers and redundant ad spending. This makes it extremely difficult for marketers to assess the true performance of their campaigns accurately, leading to inefficient budget allocation and a distorted view of actual customer acquisition, hindering effective media mix optimization. This is often exacerbated by SANs that operate as black boxes, making it hard to verify their reported data.
How can I effectively identify and reduce redundant spend in my media mix?
To effectively identify and reduce redundant spend, prioritize maximizing unique reach. This involves implementing multi-touch influencer overlap analysis to pinpoint where different networks are reaching the same users. By understanding these overlap patterns, you can then strategically reallocate your budget away from partners that deliver high overlap and toward those with a higher percentage of unique installs, ensuring that your media dollars reach new audiences.
Beyond install volume, what key metrics should I focus on to optimize for media quality?
Optimizing for media quality goes beyond just install volume, requiring you to focus on post-install events indicating true customer value. Key metrics include paid memberships, significant engagement milestones, and long-term retention rates. By establishing clear tracking for these events and using quality indices to weight your CPI calculations, you can identify and reward partners delivering high-value users, even if their initial install volume is lower or CPI appears higher.
What role does continuous monitoring play in maintaining the integrity of my media mix?
Continuous efficiency and fraud monitoring are crucial for maintaining system integrity. This involves regularly tracking metrics such as CTI ratios and CTRs to identify unusual patterns or data anomalies. By flagging and challenging outlier performance with your partners, you can address both malicious Fraud and systemic inefficiency fraud that masquerades as performance. This proactive approach ensures data quality and that your budget is allocated to justifiable conversions.