Last Modified: July 22, 2025
Cutting through the noise to find your most valuable media partners
TL;DR Summary
A heavy media mix can lead to inefficiency and increased costs due to bidding against yourself and paying twice for the same install, especially with self-attributing networks (SANs). To optimize media mix quality, marketers should…
- Uncover unique reach vs. heavily influenced installs: Identify partners delivering truly new users vs. those taking credit for users already engaged by others. Analyze influencer overlap and self-influence.
- Layer on a quality analysis: Define success based on specific KPIs beyond just installs, such as free trial starts, subscription conversions, or in-app purchases, to assess post-install user actions.
- Look to organic traffic as your North Star: Use organic traffic as a baseline to evaluate paid media partners, and be wary of “organic sniping” where partners falsely claim credit.
A case study of a gaming company demonstrated that by focusing on unique installs and post-install purchase rates, they optimized ad spend and acquired more high-value users. The article concludes by emphasizing the importance of focusing investment on partners delivering unique, high-quality traffic to achieve a smarter and more efficient growth strategy. Contact Kochava Foundry for a media mix analysis.
 In today’s crowded digital landscape, a heavy media mix is often the enemy of efficiency. Marketers are pressured to be everywhere at once, but such saturation can lead to unwittingly bidding against yourself—and driving up costs. If a partner is consistently serving ads but losing attribution, your campaigns will be deprioritized, as they’re not driving positive results for the partner or publisher.
Let’s zoom in for a moment on self-attributing networks (SANs), also called self-reporting networks (SRNs). These major walled-garden super publishers often operate on a cost-per-click (CPC) basis. They account for a lion’s share of ad budgets, and you pay them whether or not they win final attribution for a claimed install. As such, when a SAN influences a user who ultimately converts through another non-SAN partner to whom you’re paying cost-per-install (CPI), you’ve just paid twice. The SAN loses last-touch attribution but still gets paid, and the non-SAN partner gets credited and paid for the install. Without a clear understanding of this overlap and a strategy to minimize it, your overcrowded media mix can act as a leaky faucet to your budget pool.
At Kochava Foundry, we go beyond surface-level metrics to reveal which partners deliver unique, high-quality users—and which just drain your budget.
3 Steps to Assess Your Media Mix Quality
1. Uncover Unique Reach vs. Heavily Influenced Installs
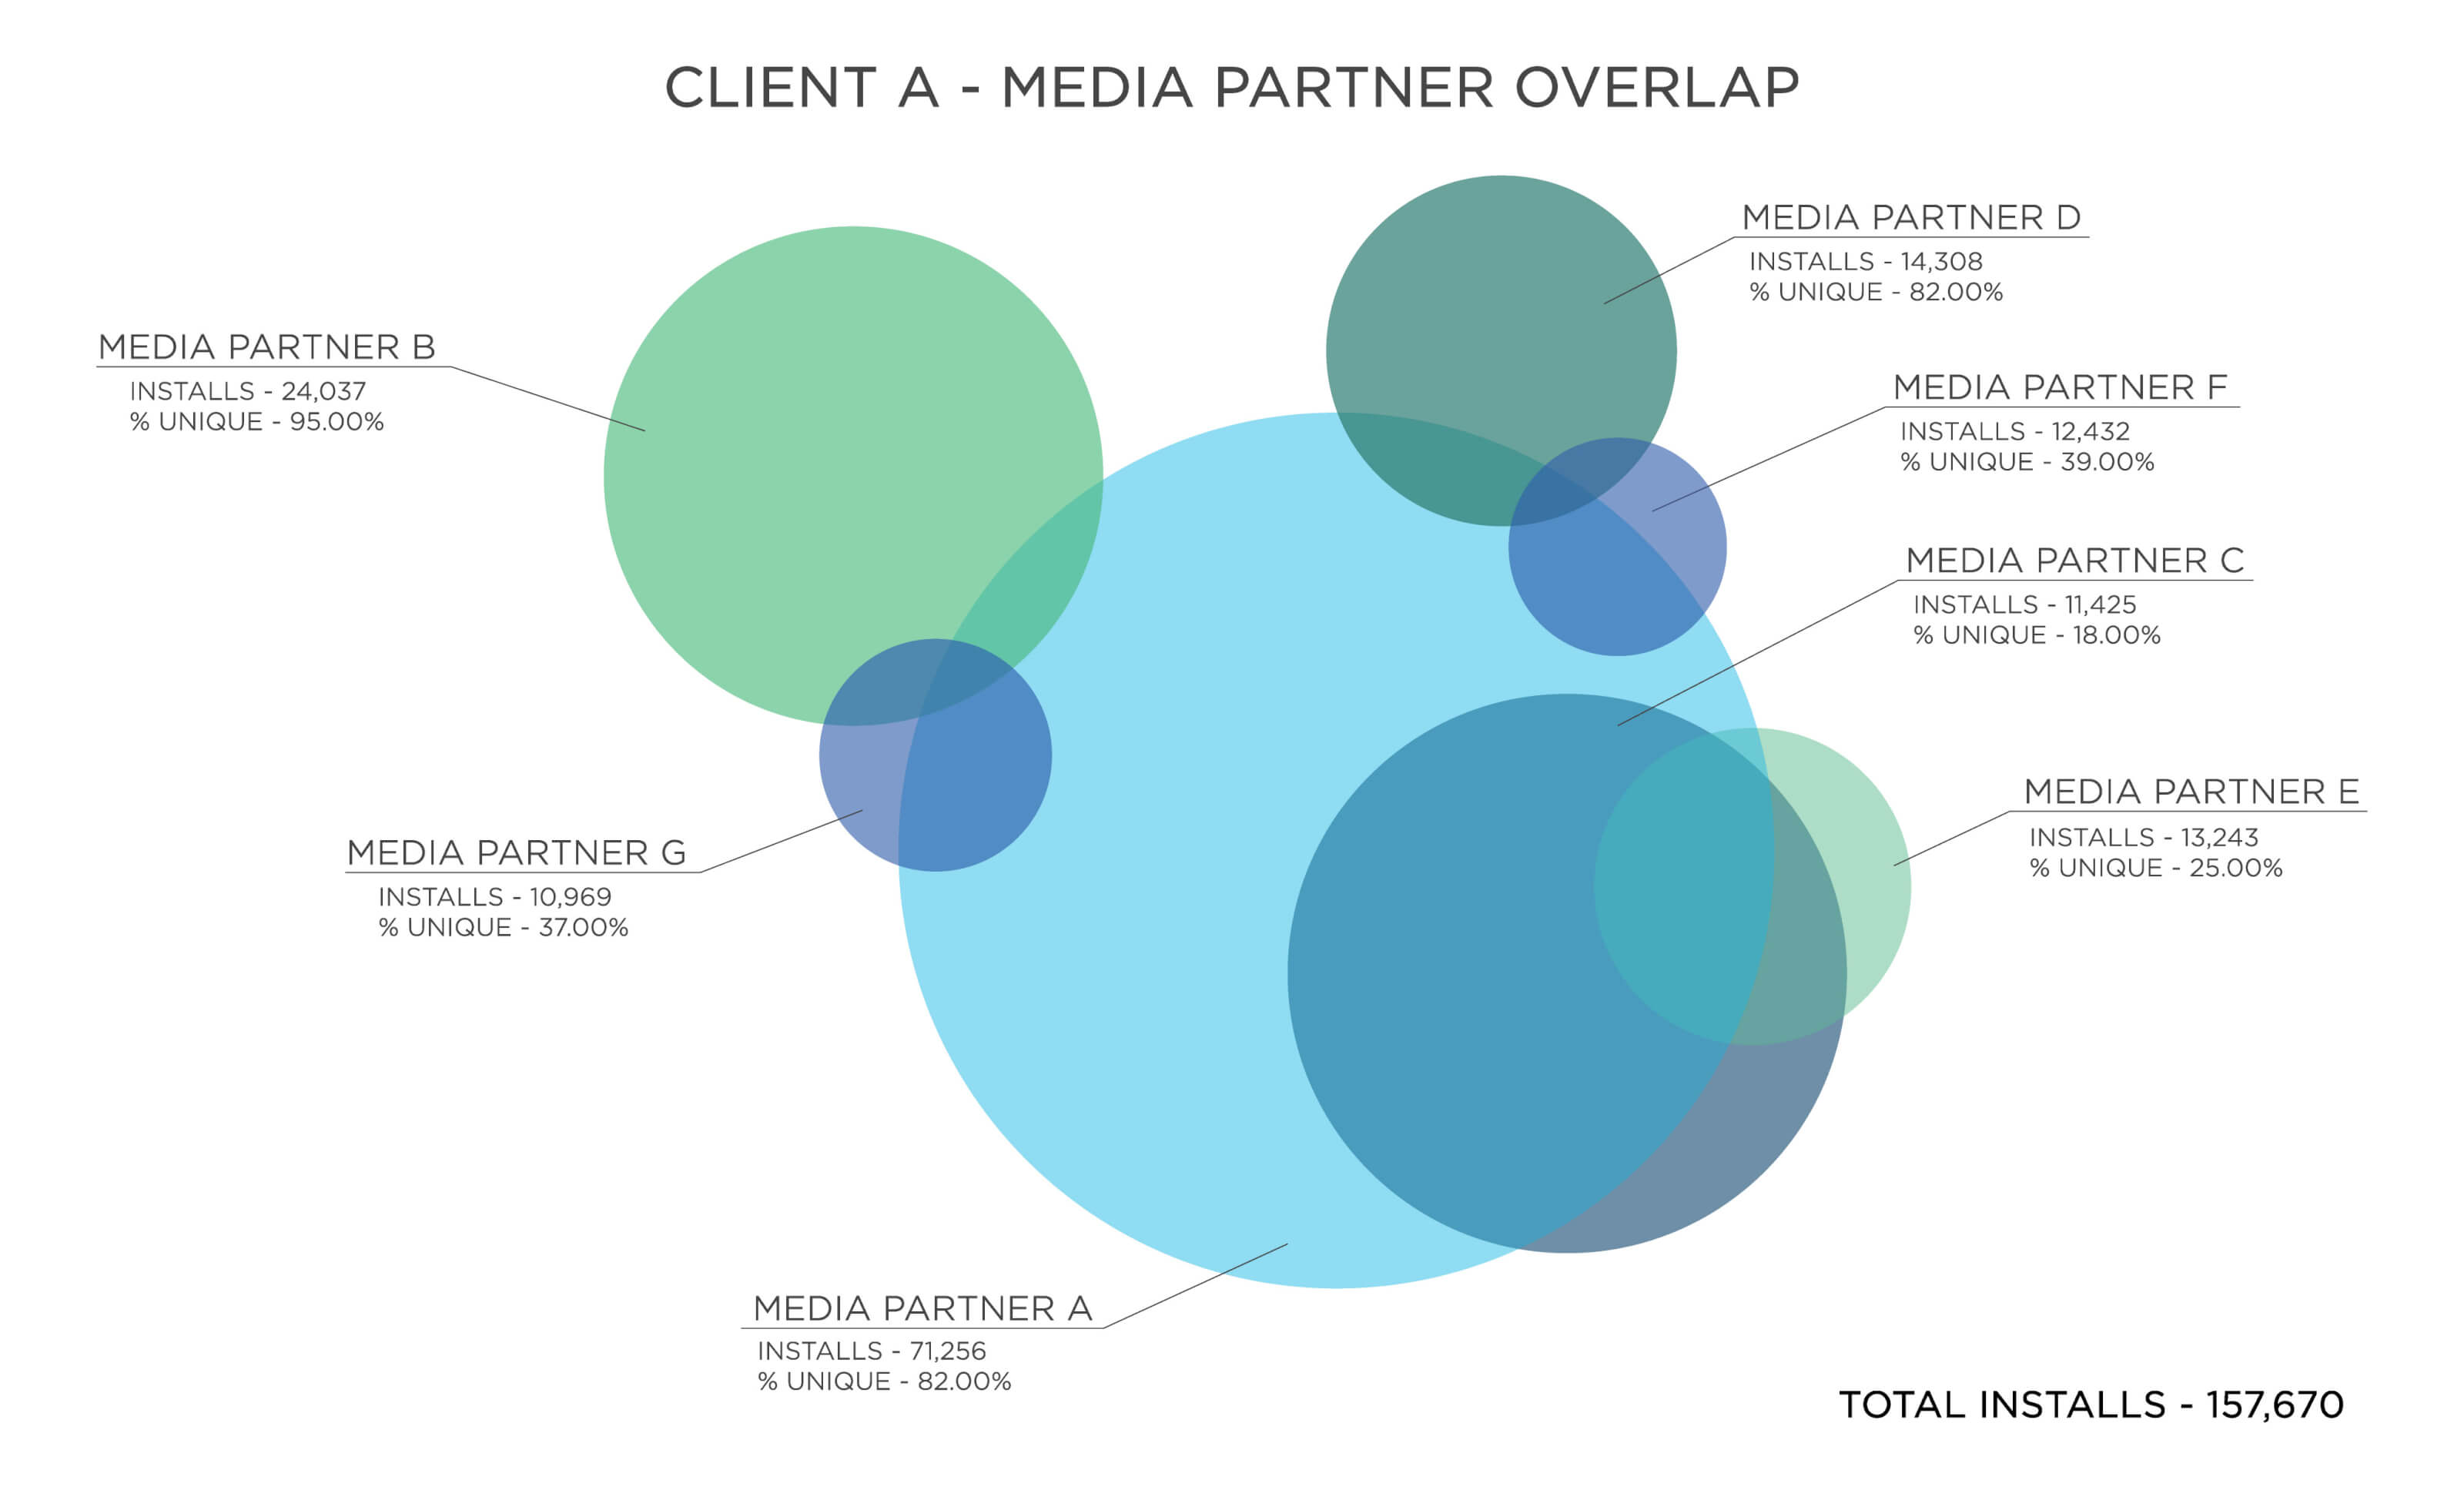
The first question every marketer must ask is How many of a partner’s attributed installs are truly unique? Is a media partner delivering new users you wouldn’t otherwise have reached, or are they simply taking credit for users that other partners have already engaged?
When media partners compete for the same ad placement, they cannibalize each other’s efforts. Using multi-touch attribution, Kochava Foundry analyzes the entire user journey to identify two key issues:
- Influencer overlap—partners stepping on each other’s toes: When two networks show significant overlap with minimal unique reach, it’s a clear signal to consolidate your spend.
- Self-influence—partners repeatedly serving ads to the same user: A high number of self-influenced conversions may indicate poor frequency capping, leading to wasted ad spend and a negative user experience.
Get Better Measurement Data to Optimize Your Media Mix
2. Layer on a Quality Analysis
An install is only the beginning; true performance is measured by what users do after they arrive. By adding a qualitative layer to your analysis, you can assess partners based on the downstream actions that matter most to your business.
This requires defining success based on your specific vertical and key performance indicators (KPIs), for example:
- Streaming: free trial start, subscription conversion
- E-commerce/QSR: first, second, or third purchase within a set timeframe
- Gaming: level complete, in-app purchase, session
The ideal partner doesn’t just deliver installs; they deliver unique installs that convert into high-value customers.
3. Look to Organic Traffic as Your North Star
Your unattributed (organic) traffic provides an essential quality baseline. Since these users actively seek out your app, they often demonstrate the highest levels of engagement. By measuring your paid media partners against this organic benchmark, you can quickly spot who is over- or underperforming.
Be wary of partners whose performance perfectly mirrors your organic traffic trends. This can be a red flag for “organic sniping”—a tactic where a partner uses click flooding or injection to take credit for users already on their way to converting in your app. Implementing fraud prevention tools and optimizing configurable attribution controls are your best defense against this budgetary drain.
Uniqueness & Quality Case Study: How a Gaming Company Optimized Ad Spend
A gaming company running campaigns with 10 media partners wanted to optimize its budget around a single KPI: a purchase within 7 days of install. An analysis charted each partner’s performance based on the percentage of unique installs they delivered and percentage of unique users making a purchase in 7 days. The results were immediate and clear.
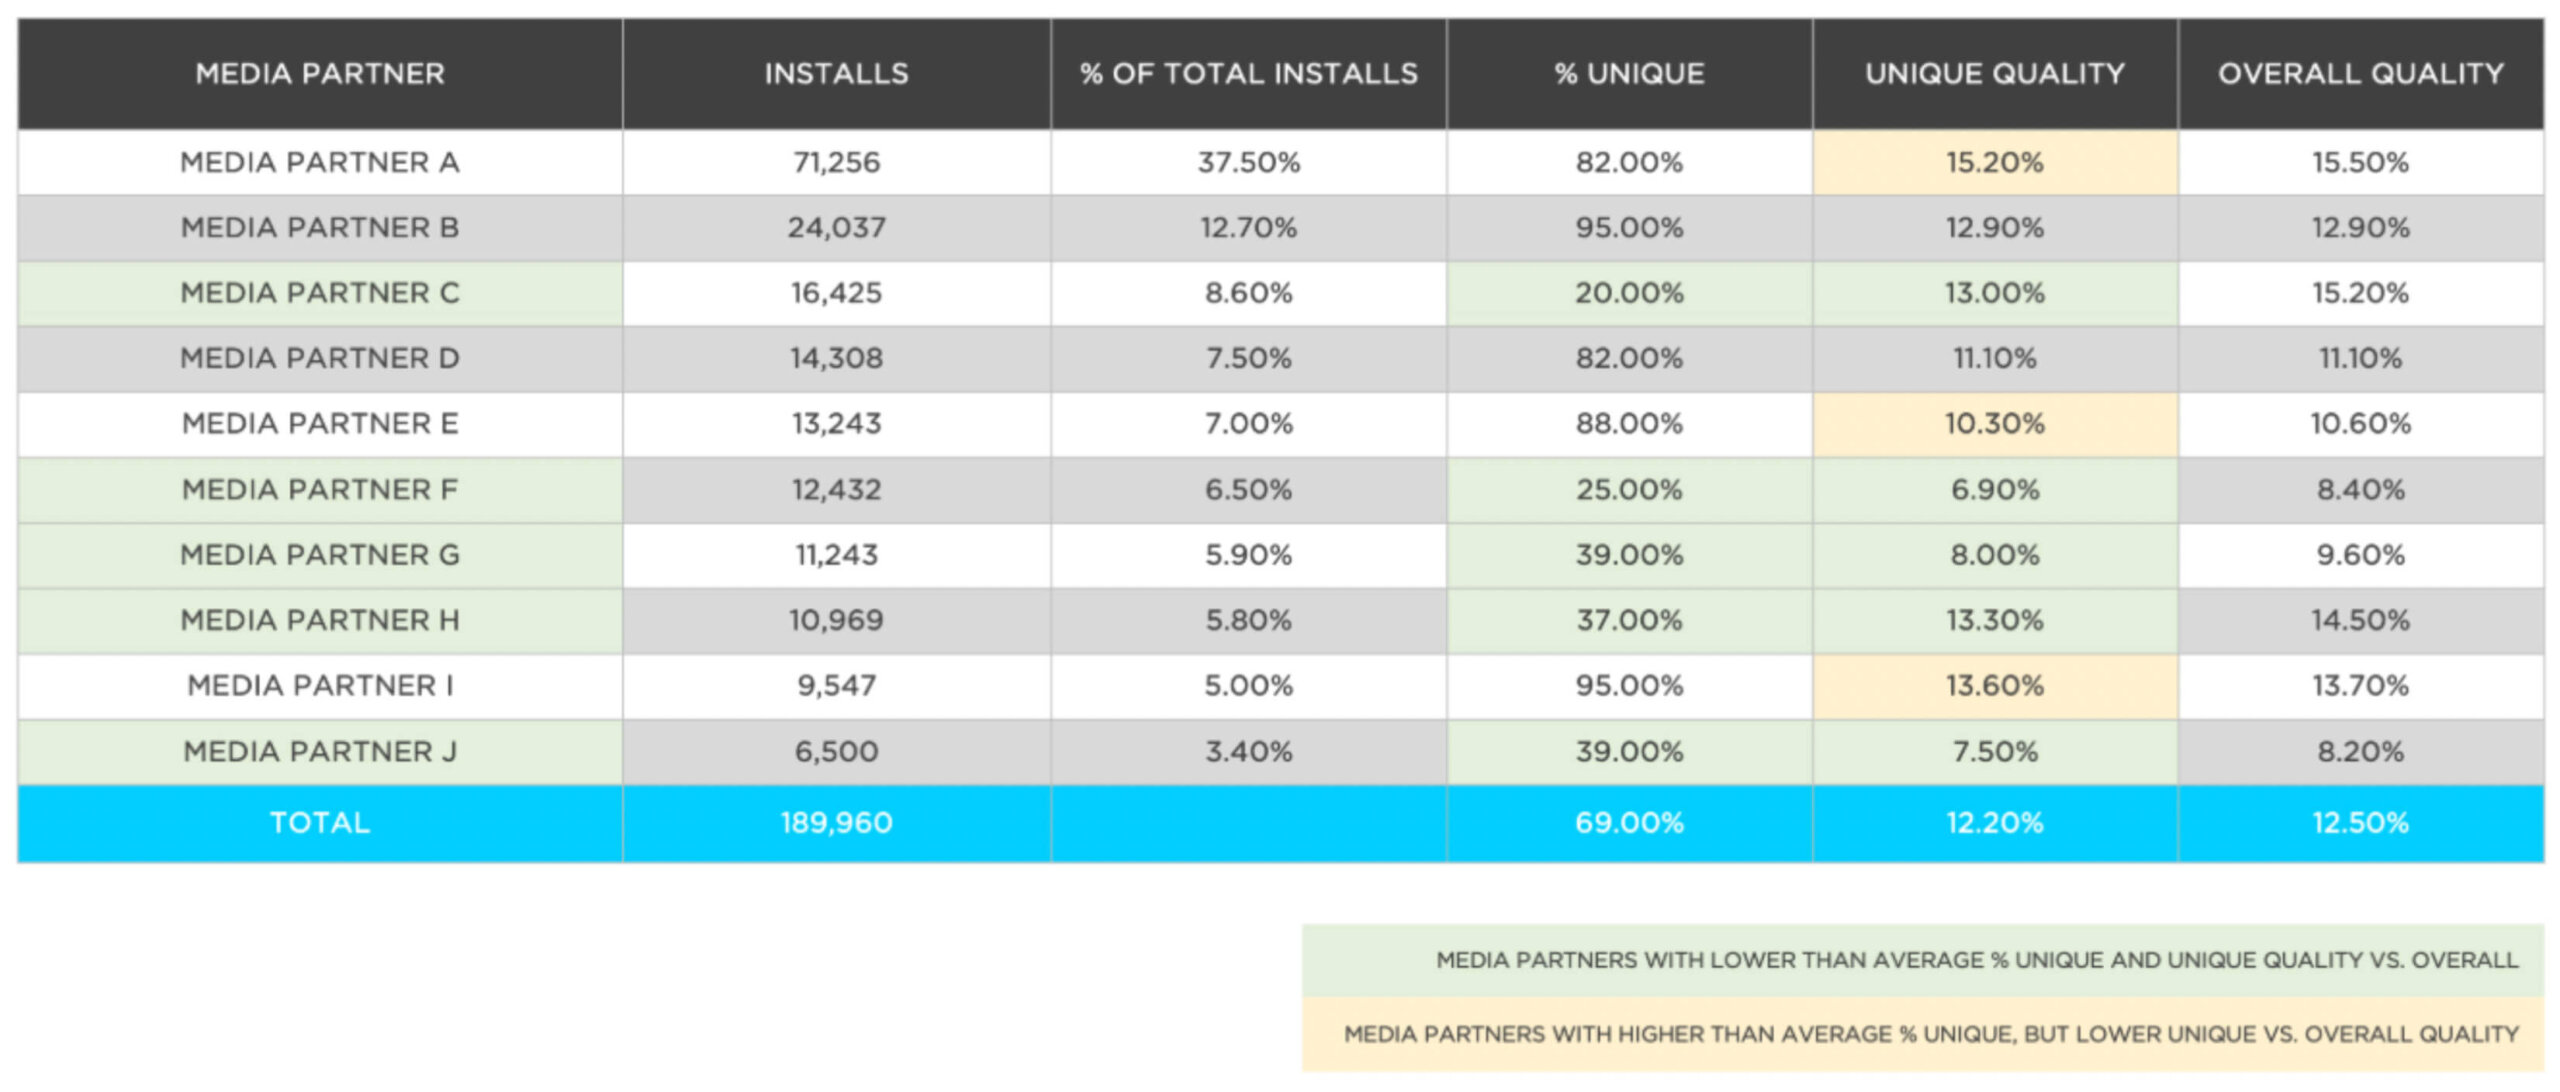
Results
Five of the 10 partners delivered unique installs at a rate lower than the campaign average, and the quality of those installs was also below average.
For example, one partner had only 25% unique installs, and these customers had the lowest overall purchase rate. This means that three-fourths of the partner’s attributed installs would have come from other channels anyway, and the few unique users it did bring were not valuable.
Next Steps
By cutting ad spend with the five underperforming partners and reinvesting budget into top-performing sources, the company acquired more high-value users for less ad spend, dramatically improving marketing efficiency.
Your Path to a Smarter Media Mix & Greater Spend Efficiency
Ultimately, you should focus your investment on the quality of a media partner’s unique traffic. These are the installs you would miss entirely without this partner in your mix. By cutting through the attribution noise and focusing on partners who deliver unique reach and strong post-install performance, you can build a smarter, more sustainable growth strategy.
Connect with Kochava Foundry to discover your highest-value media channels and drive sustainable growth.
Want to receive more helpful content like this in your inbox? Subscribe to the Kochava Newsletter.