What you need to know about varying benchmark statistics for Apple’s ATT framework
Since Apple’s iOS 14.5 launch April 26th, and along with it, the AppTrackingTransparency (ATT) framework requiring user consent to ad tracking, the adtech industry has been monitoring the rollout weekly. With user adoption low so far, reported ATT opt-in rates are initially bleak, but marketers must keep in mind that the reported rates also depend on how they were calculated.
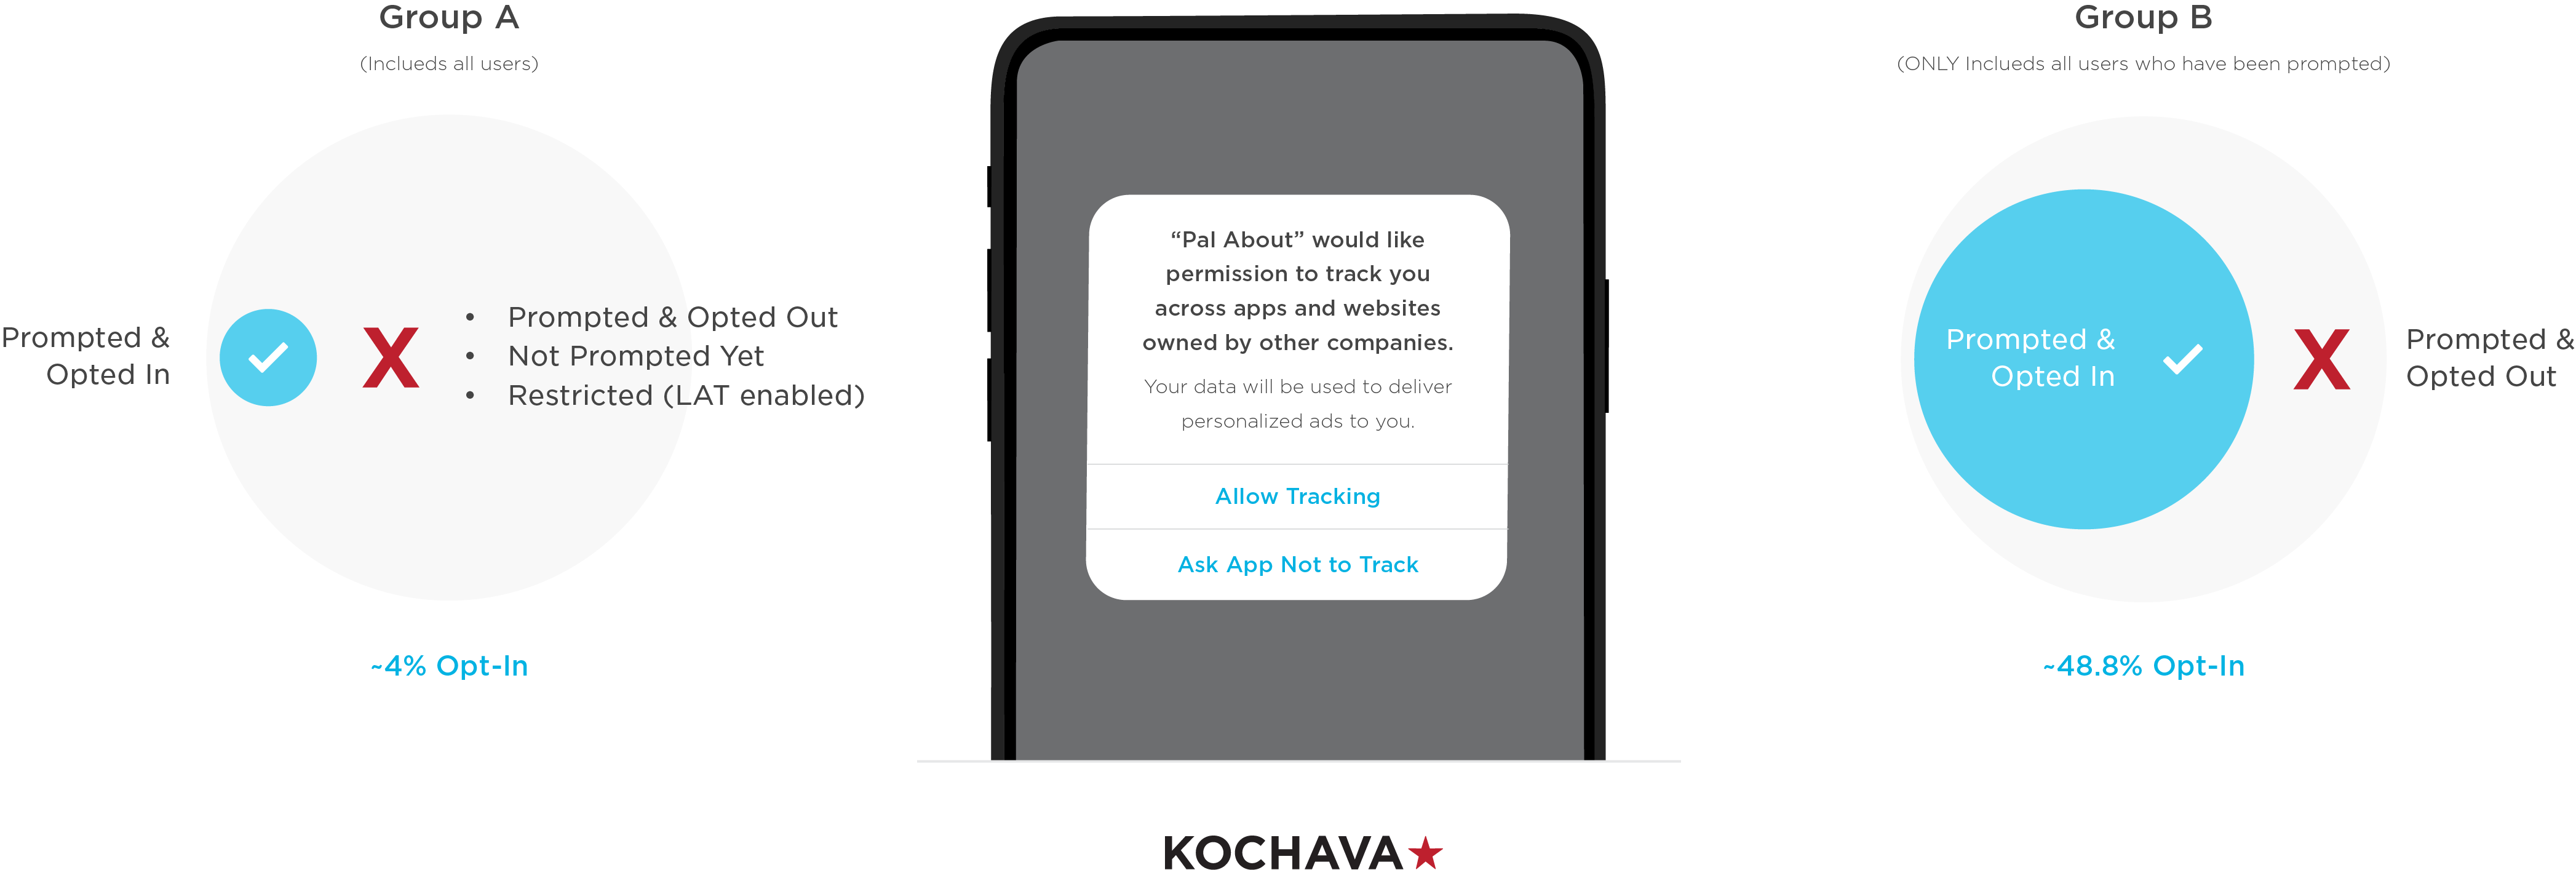
Several vertical outlets have been reporting Flurry Analytics’ statistics where they observed a 4% opt-in rate for iOS users in the US and an 11% opt-in rate worldwide. Others such as Lifestreet are reporting a 10% opt-in rate among apps in their inventory. At Kochava, within a 7-day window ending May 7th, we are seeing 48.8% opt-in among iOS 14.0+ users who are actually being prompted.
Why do the metrics for ATT opt-in rates vary?
The answer depends on the sample data set and the analysis approach. The Flurry Analytics report observed a 4% opt-in rate among iOS users in the US. That sampling is from the users who have upgraded to 14.5, have been prompted for ATT, and have accepted. They report that the portion of iOS users that are restricted (those not eligible for receiving the prompt) is 5% worldwide (out of 5.3M daily active users [DAU]) and 3% in the US (out of 2.5M DAU). Some media outlets, however, are interpreting those stats to mean that 96% are opting out of ATT which is not accurate.
Measuring those who opt-out is not as clear cut because that group may also include users who may not have been prompted yet (which is the overwhelming majority of the 96%), or may have enabled Limit Ad Tracking (LAT) pre-iOS 14 in which case, they have automatically not consented to ad tracking and aren’t available to be prompted at all (eg, restricted). In addition, keep in mind that apps are not required to prompt their users. Certain apps may have no need for access to the identifier for advertisers (IDFA) nor the advertising measurement and targeting that are restricted without opt-in. These instances would also fall into the opt-out bucket. Additionally, users may be accepting the prompt for some apps but not for others, so the stats are dependent on the apps available for analysis within the data set.
At Kochava, we are analyzing our internal data set which narrows the population of apps from the start to those that measure with Kochava. When we calculate an average opt-in rate we can do so in one of two ways. In the graphic below, Group A considers all iOS 14+ users regardless of whether they have been prompted via ATT or not. As such, the opt-in rate is far lower at just 4% when measured against all of the users who (1) were prompted and opted out, (2) weren’t prompted yet, and (3) were restricted from being prompted due to Limit Ad Tracking (LAT) already being enabled on their device. On the other hand, Group B only measures opt-in rates for instances where users actually got prompted and made a choice. One could argue that Group B better represents the universe that marketers can make an actual impact on.
There are other factors that will impact observable ATT opt-in rates. Marketers employing a mobile measurement partner (MMP) such as Kochava are a step ahead of the millions of apps in the App Store who may not have a marketing team at all. As such, MMP ATT averages are likely to be a bit higher, given the apps that measure with them have the resources to run marketing, optimize their in-app experience, and execute sophisticated test & learn strategies to maximize opt-in rates over time.
Further, the brands that measure with Kochava have greater brand equity and in large part are trusted by the customers they serve—lending to higher opt-in rates. Note that the App Store has just over 2M apps, and there are many small and long-tail apps that may have little-to-no brand equity. If they’re included in an analysis, the average opt-in rate is likely to drop. Ideally, all apps have been cultivating their brand awareness so that when they prompt their users for consent, they have already established a level of trust with their users. The bottom line is it’s difficult to determine a universal average opt-in rate among so many different variables and angles of perspective.
What’s the true average ATT opt-in rate?
Apple itself would be the only entity capable of truly answering that question. They have visibility to every app in the entire App Store and the opt-in rates of every user in every app instance. Whether Apple releases this data point remains to be seen.
What can marketers do?
The current 4% opt-in stat may seem depressing at first glance, but there are a couple of things to consider. First of all, we are still in the early stages of the 14.5 rollout. Second, you as a marketer only have control to impact the users you can actually prompt, and opt-in rates are much higher when looking at the situation from that perspective. Finally, there are several things you can do in creating your ATT prompt strategy to maximize user IDFA opt-in. Of most importance is educating your users about consent in a brief and efficient manner. Gone are the days of lengthy user agreements. Users want clear and concise information and in providing that, marketers will have yet another way to strengthen their user relationships and become a trusted brand.
For more information, visit our iOS 14 Resource Center for informative content and the latest updates, or contact us for a free consultation.