Use influencer reporting and What if? Scenarios to hone future campaigns
In the current climate of mobile and app attribution, last-click attribution is still the standard. However, there is a lot to be learned from influencer reporting. Influencer reporting surfaces clicks and impressions that occurred but did not result in an install. Influencer data offers significant insight into your campaign performance as well as optimization opportunities. Examining each network’s ratio of installs to influencers reveals key takeaways that can drive optimization and identify the type of users to target.
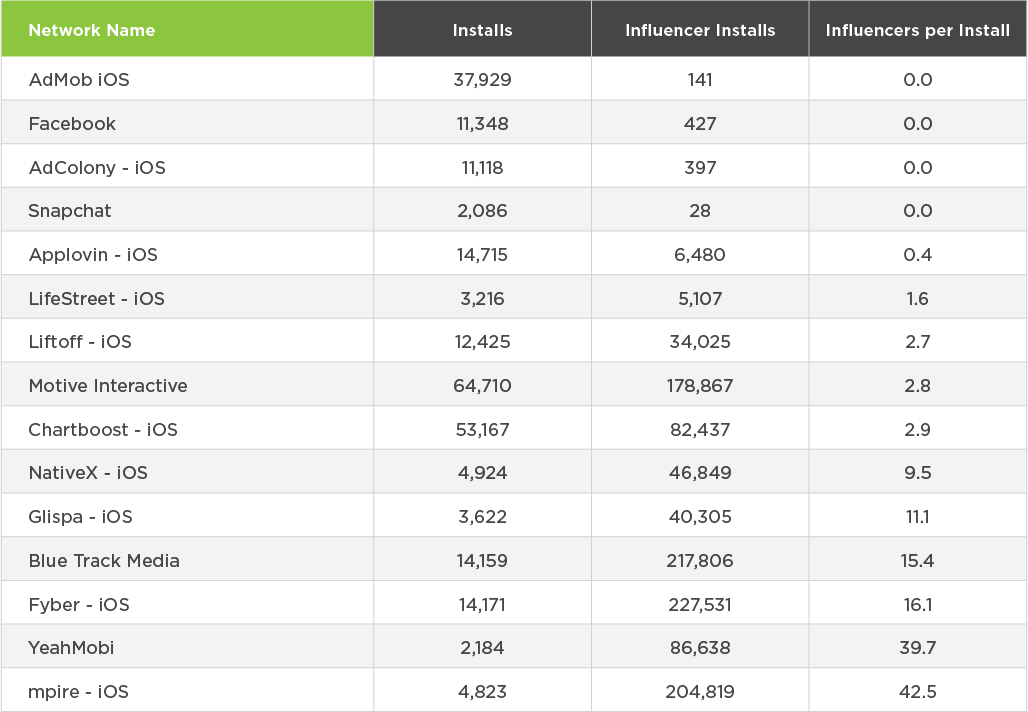
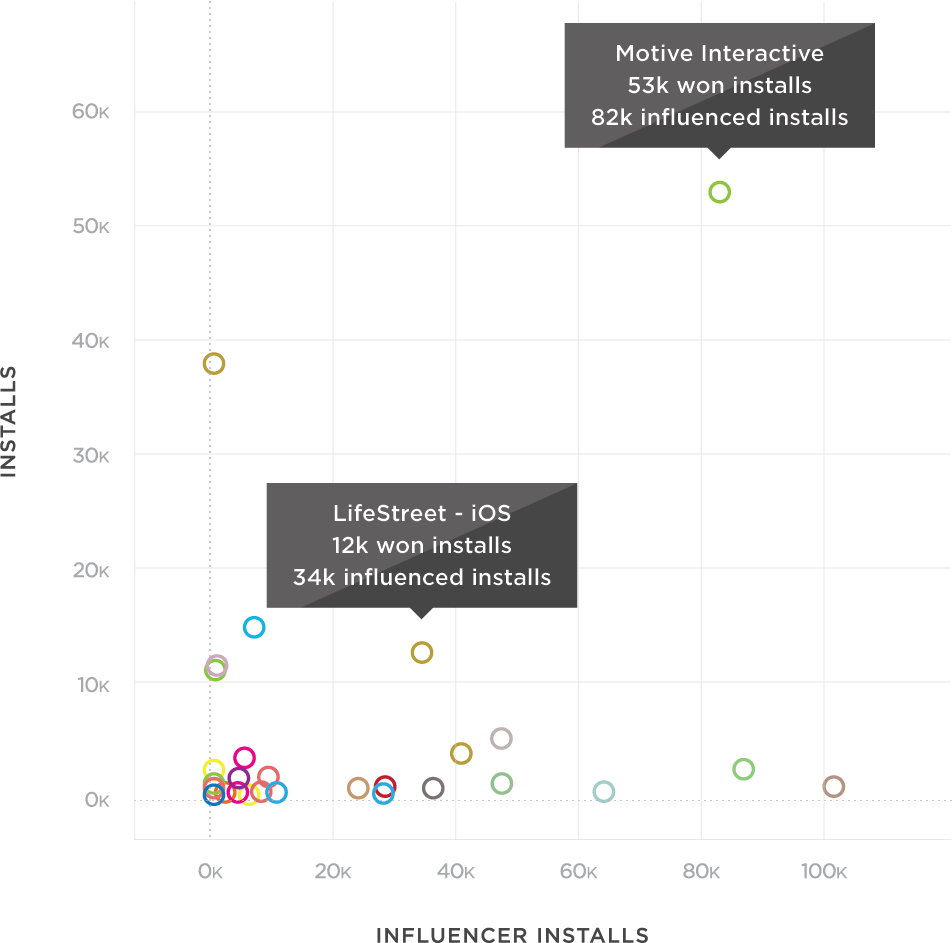
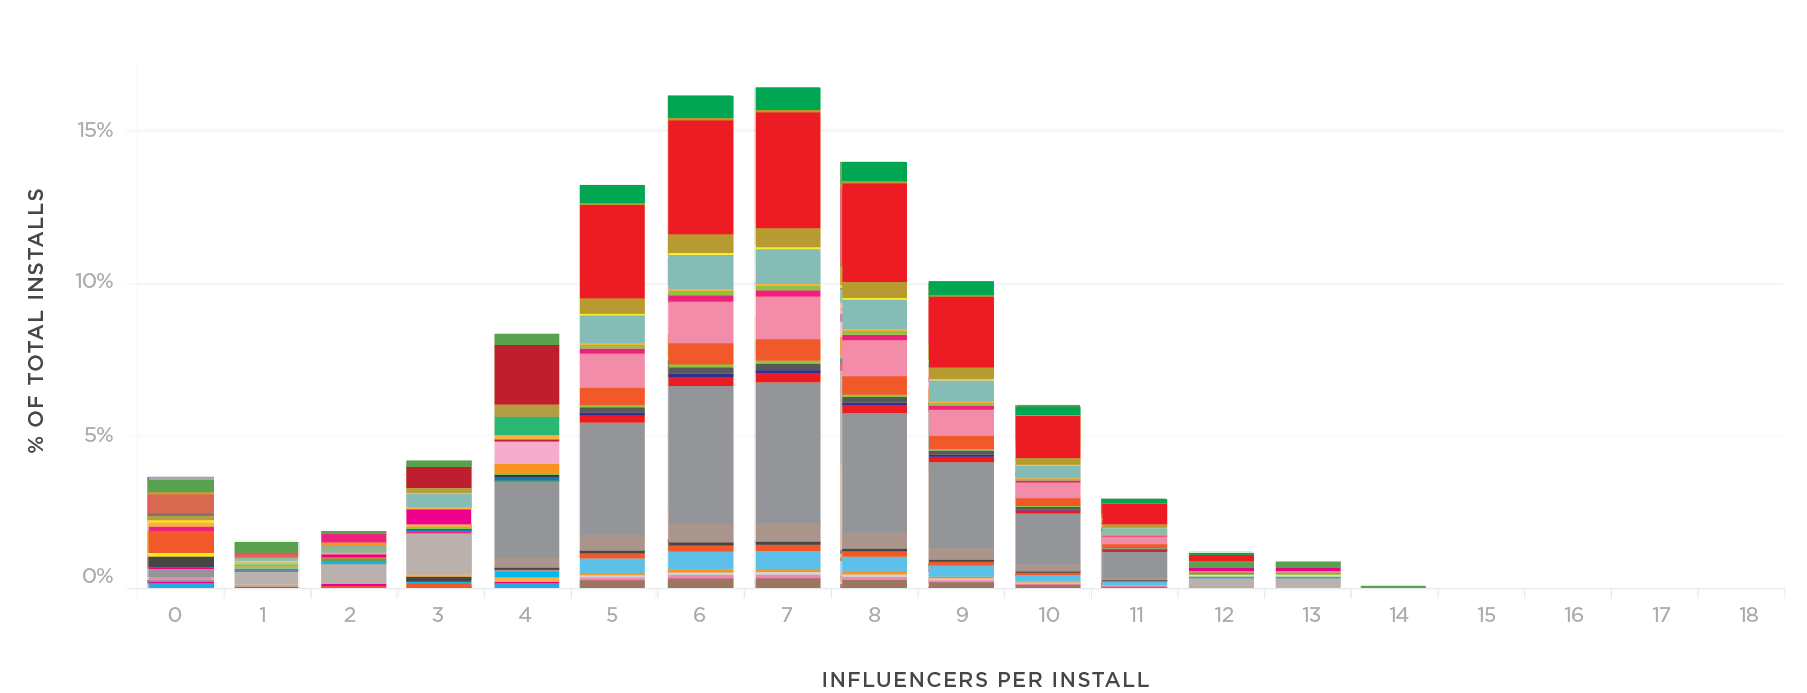
Let’s look at the difference between influencing and attributed engagements as influencers versus closers. You’ll notice that every network has its own unique mix. Some networks are heavier on closers, some drive more influencers, and some have an even distribution of both. This data can give us an influencers/install metric that reveals which networks drive (primarily) unique traffic.
While this data is informative it does not give qualitative, actionable insight into campaign optimization. At first glance, it might be tempting to believe that networks with fewer closers are not additive to the overall campaign success, but this is not necessarily true. Applying an exposure-response curve shows that the first impression delivers the strongest value, with each subsequent impression decreasing in influence. You may conclude that networks with a high volume of influencers drive the most value. However, it may be too great a risk to decrease traffic on those networks that are actually closing the deal.
Reach versus Frequency
When it comes to choosing between targeting new users or retargeting known users, consider the role and value of influencers. When it comes to acquisition, the first impression is the most valuable while the potency of the impression decreases with each subsequent serve.
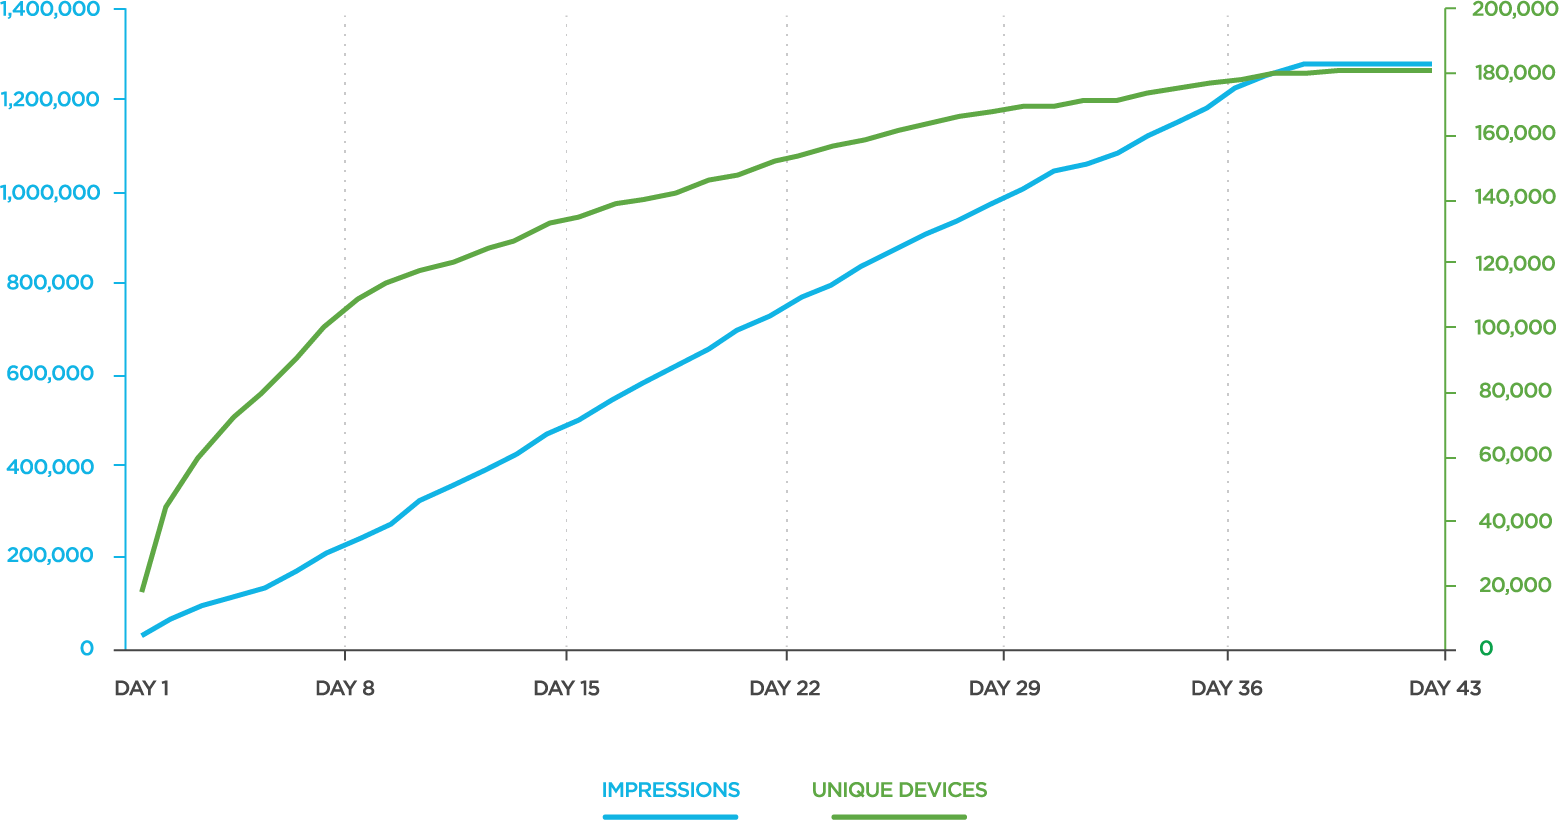
The chart below shows the relationship between impression volume and unique devices on a given network. Over the life of this campaign, an average of 6.2 impressions are served per device. However, during the first week, only 1.2 impressions are served per device. The network delivers impressions at a set rate to fill the IO while its ability to find new unique users flattens. The longer the campaign runs, the more likely a user will be served the ad more than once (an average of 6.2 times, in this example). To avoid oversaturating a target group, set a lower frequency cap for the campaign. This will ensure that users not served ads beyond a given frequency.
What if?
Influencer reporting reveals several key insights into campaign performance, however, the process of optimization requires some guesswork. Eliminating a network with more influencers than closers may reduce overlap, but if that network often served the first impression, losing them could be detrimental to campaign performance. What if you could remove a network with a large number of closers as an exploration into whether the users would have installed based on the influencing networks?
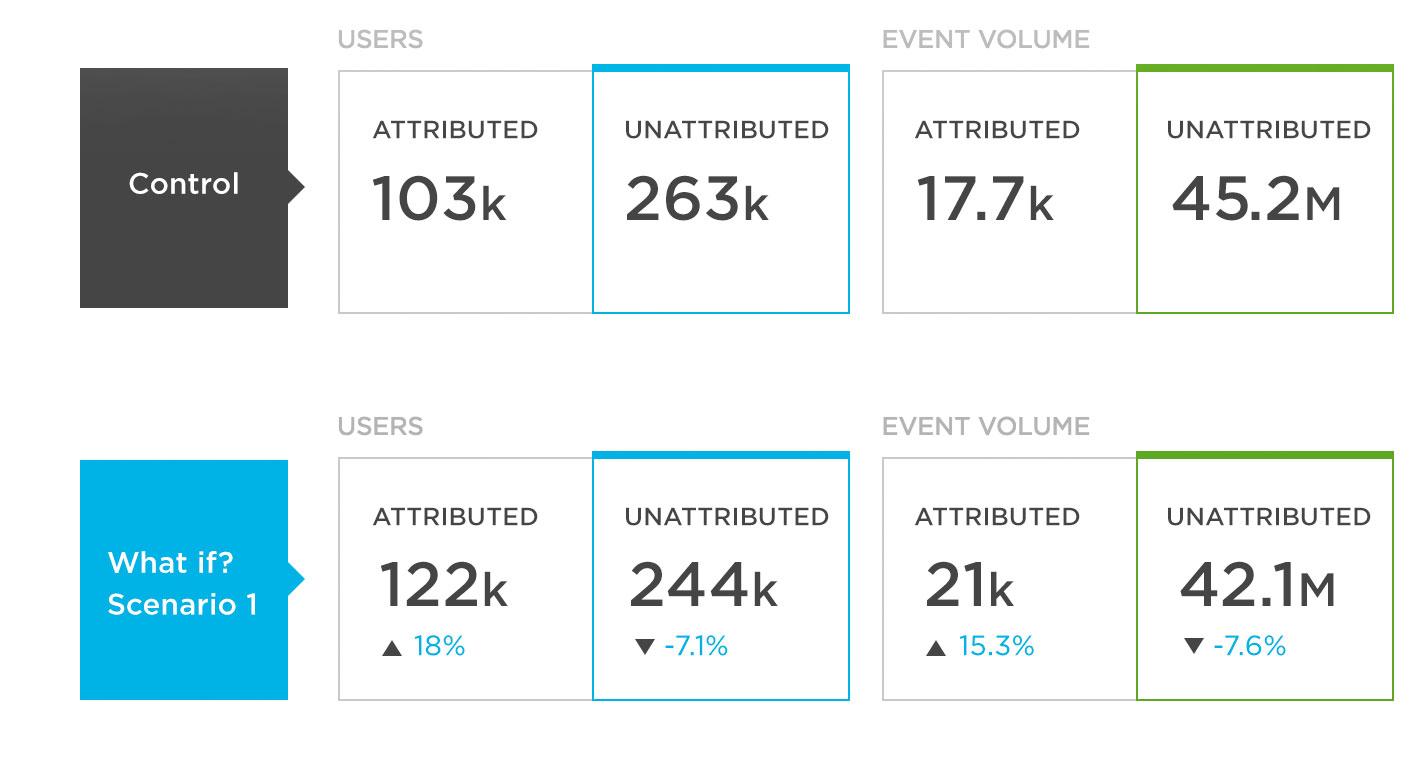
The What if? tool developed by Kochava, allows you to do just that. Campaigns can be configured with different settings and hypothetically rerun. In this case, a customer could create two different What if? Scenarios to compare the results of removing the highest-influencing network and the highest-converting network. Based on the results of these two What if? Scenarios, real-world decisions can be made with confidence.
Key Takeaways
- Influencers versus Closers: Influencer reports show which engagements (clicks and impressions) happened but did not win the install.
- Networks vary significantly in their mix of influencers and closers and overlap among networks is expected.
- Having more influencers than closers does not necessarily mean the network is less additive to campaign success.
- In this use case, 97% of installs were touched by multiple networks.
- Networks do not all behave equally.
- There is no direct correlation between install volume and uniqueness.
- In an effort to get networks to maximize reach, tighten the frequency cap via influencer reporting, you’ll see the distinct reach by network more clearly.
- Use What if? Scenarios to test removal of specific networks or different attribution settings to see how they will impact live campaigns.