How AI shopping agents, retail media networks, and a season split in two moved the purchase decision off the dashboard
TL;DR Summary
Back to school 2026 has split in two: Promotions migrated to June while households have waited, leading to the earliest start on record and later spending than previous years. AI shopping agents now settle the decision inside conversations that leave no click, no session, no referral. With demand guaranteed and the trail gone, back-to-school incrementality testing answers the all-important question: How much would have been bought anyway?

On a refrigerator, pinned under a magnet, a piece of paper issued by an institution with no interest in anyone’s budget. Two glue sticks. A 24-count box of crayons, not the 64. Dry-erase markers, four to a pack. Two boxes of tissues and a canister of disinfecting wipes, for the classroom. Pocket folders with prongs, in red, blue, yellow, and green. Wide-ruled composition notebooks, quantity two. A backpack, no wheels.

The list arrives earlier than it used to: 44% of households already held one by early June, up from 38% in 2025. The purchase order arrives whether or not anyone advertises; no campaign creates the demand for two composition notebooks (and no one can talk a parent out of them). It’s fulfilled in June at a promotional price, or the week after school starts at whatever’s left on the shelf.
Which makes back to school the strangest assignment in marketing: guaranteed demand—a record $43.3 billion for K-12 alone this year—with a 29-year argument over who gets credit for it.
The Manhattan Mall, 1997
On August 10, 1997, Mayor Rudolph Giuliani announced a discount. As per New York City press release #478-97: “All of New York City will be having a back-to-school sale.” Clothing under $100 an article, no state or city sales tax, September 1–7. During sale week, Giuliani declared it “Christmas in September.”
This wasn’t the first run: New York enacted the exemption in 1996 and held its first tax-free clothing week the following January. September was the back-to-school edition.
And it wasn’t really about school. New Jersey doesn’t tax clothing, and New Yorkers noticed. They crossed the bridge for jeans and took the rest of the cart with them—a leak the city’s own Economic Development Corporation figured at $700 million per year in clothing, $3.5 billion for all purchases.
The First Test Flunks
Then New York did something novel: It measured its own creation.
The state’s Department of Taxation and Finance analyzed the effect. Clothing sales ran about $174 million above a typical week, a spike any marketer would take to the board. But the department’s read was that much of the volume “were not new sales generated by the exemption but sales that would normally have occurred during prior or later weeks.”
Not new demand. Borrowed demand. The first-ever back-to-school incrementality test, run by the government that invented the event, and it flunked.
FOMO Race
The idea traveled; the finding didn’t. Florida copied it in 1998, Texas in 1999. Michigan lawmakers, citing a 20–25% sales bump across New York’s holidays, filed 10 exemption bills. By 2001, 17 states were running their own.
They read the spike, not the caveat, which was public. The FOMO compounded.
The Inventor Walks Away
Then New York quit.
Effective March 1, 2000, the temporary holidays gave way to a permanent, year-round exemption on clothing and footwear under $110, timed so the state could still collect $150 million in sales tax over the preceding holiday season.
The exemption survived a budget crisis and suspension. The holidays never came back. The tax department publishes a bulletin headlined “Back-to-School Savings: Enjoy a New York State Sales Tax Holiday Every Day.”
The state that invented the back-to-school sales tax holiday measured it, found it mostly moved demand around the calendar, and walked away. Twenty states play on with sales tax holidays of one kind or another; Florida’s “week” now runs for a month. New Jersey, whose untaxed clothes started the whole thing, tried a holiday of its own in 2022, repealing it after two seasons.
Both original players have left the field.
Twenty-Four Hours in the Dead Zone
The next escalation came via ecommerce.
On July 15, 2015, Amazon’s 20th birthday, the company staged the first Prime Day: 24 hours, nine countries, a holiday manufactured to fill midsummer, retail’s dead zone. By Amazon’s account, the day beat Black Friday 2014 as its biggest ever.
The Ratchet Turns One Way
Walmart, Target, and Best Buy answered. Not because they wanted a July holiday, but to counter one Amazon already built. An idle July isn’t restful when a competitor is filling it.
Twenty-four hours became 48 by 2019, then 4 days by 2025 with an October sibling attached, until the trade shorthand for the month became “Black Friday in July.”
 Amazon Leaves July
But Amazon bumped it forward. The 2026 event ran June 23–26, the company citing a crowded summer calendar including FIFA’s World Cup and the U.S. semiquincentennial. Target and Walmart moved in behind it. Neither retailer picked June—Amazon picked June. Nearly three in five of 116 retail brands ran Prime-Day-tied promotions.
By top-line measure it worked. Adobe put U.S. online spend across the four days at $26.4 billion, up 9.3%. Back to school came with it: Adobe’s final figures show kids’ apparel up 140% against the June daily average, backpacks up 115%—10 weeks before the first bell. A soccer tournament moved the lunchbox calendar.
And shoppers enjoyed it less: 59% were satisfied with this year’s deals, down from 68%, and spend per trip shrank, though discounts largely matched the previous year’s depth.
Longer event, same discounts, less satisfaction, smaller baskets. The spike again, this time with the footnote along for the ride.
Fifteen Points via a Date Change
The move showed up in the advertisers’ own numbers. Tinuiti reports that Amazon Sponsored Products spend across its advertisers grew 38% year over year in Q2 2026—but strip the Prime Day dates out of both years and the same accounts grew 23%. Fifteen points of a major channel’s reported growth because of a calendar decision. Tinuiti expects the mirror image in Q3, when advertisers lap a July 2025 event that no longer sits in July. Amazon told its investors the same thing: Strip Prime Day out of both years and its third-quarter growth forecast increases almost 4 percentage points. Buyer and seller, adjusting for the same calendar decision.
The Season Splits in Two
Promotions keep migrating earlier. Decisions haven’t followed.
NRF and Prosper Insights, who measure when shopping begins, find 62% of households having started by early July, with about a third already going in early June, the earliest start NRF has recorded since first asking in 2018. Deloitte’s 2026 survey of K-12 parents, measuring when the money moves, finds just 48% of planned spending by the end of July, down from 61% a year ago.
Earlier start, later spend. Same households.
Starting Is Not Spending
The distance between the instruments is the season in miniature. Among households that have completed less than half their shopping, 46% are simply waiting for better deals. The browsing is real. The buying is on hold.
Two Clocks, One Season

K-12 started earlier than ever and is paying later. University gets going just before the promotional calendar closes, with record-high spending: Back to college runs to $103.5 billion, more than $1,400 per family—an increase NRF attributes largely to computer prices—inside a window that opens 3 to 4 weeks before classes. Some students spend upward of $10,000 on a dorm build.
Adobe expects online spending to peak in the first two weeks of August, roughly double early-July levels. If you’re reading this in mid-August, you’re standing inside both peaks the promotions left behind.
Paying More for the Same List
Apple raised MacBook and iPad prices in late June 2026, citing a memory shortage it called an unprecedented challenge, as AI data centers bid RAM away from consumer devices. The technology that households are now deploying to hunt discounts is raising the price of what they hunt, and families are answering accordingly: clothing spending up 22%, technology down 16% as upgrades get deferred another year.
It Isn’t Optional
NRF’s read of its own data is that families are not willing to compromise on school purchases, with 38% cutting back in other categories to protect them.
They arrive on top of everything else. KPMG found 83% of consumers expecting to spend more on groceries this year, as well as gas and prescriptions. The school list is one line in a budget where every line is moving the same direction.
The Advertiser Pays a Peak Too
Alison.ai puts back-to-school CPMs 25–40% above baseline between mid-July and late August, with creative fatigue at a median of 8 days. Meaning some of the year’s most expensive impressions are aimed at a household that has already written its list.
The Parable, Told a Second Time
Assessing record Prime Day results, AlixPartners’ Sonia Lapinsky reads the pattern as households pulling forward purchases “that they were going to buy anyway.” KPMG’s July pulse finds per-child spending up 6%, with nearly 80% of parents saying the increase buys the same goods at higher prices.

And the households working hardest to save are not the ones spending least. The hyper-value seekers—the 31% deploying four or more value behaviors—spend 14% more than everyone else. Hunting the discount is not the same as reducing the bill.
Record volume, flatter basket. The sale moves, the purchase doesn’t.
The Household Automates Its Half
Here’s an example back-to-school buying sequence in 2026:
- June 24: The school hasn’t posted this fall’s list yet, but last year’s is close enough for now. A parent has an AI agent watch three items and buy the backpack if it drops below $30. Prime Day is running. Nothing hits the number.
- July 14: The actual list goes up. Two items weren’t on last year’s. The agent hasn’t been watching those, and the June discount ran weeks before the household knew what to buy.
- August 9: The backpack dips to $30 at 11:40 PM on a Sunday night. The agent buys it. Nobody in the house is awake.
- August 12: A teenager asks a chatbot which graphing calculator the syllabus means. It tells her, offers a cart, and takes the payment. She never visits a store, site, or search bar.
None of this produces the one thing everything downstream is waiting for.
The Delegation in Numbers
Families have spent three decades learning to wait retailers out. In 2026, they’ve automated it. Twenty-three percent of consumers now use AI specifically to shop, compare, or hunt deals—a channel a fraction of this size a year ago. Tinuiti’s survey of U.S. parents finds 68% using conversational AI agents to simplify buying, with the top three use cases as hunting the best deal, comparing products, and summarizing reviews. Accenture finds that 74% would trust a personal AI agent over their best friend to buy for them, alongside marked distrust around financial safety and cybersecurity.
The errand gets delegated; the nerves stay.
The Rails Arrive to Meet Them
Two protocols compete to standardize the plumbing: ACP (Agentic Commerce Protocol) from OpenAI and Stripe, UCP (Universal Commerce Protocol) from Google and Shopify (with Walmart and Target behind it). They have split on where the money changes hands. OpenAI pulled back its in-chat checkout in March, routing buyers back to the merchant and keeping ChatGPT to discovery. Google has gone the other way: Universal Cart, rolling out across Search and Gemini this summer, holds items from several retailers and takes payment without the shopper leaving the surface.
The volumes are already substantial: Roughly 2% of ChatGPT queries—about 50 million a day—are shopping-related, and AI platforms are expected to reach almost $21 billion in U.S. retail spending—close to 4X the 2025 level. Amazon’s Alexa for Shopping watches price history and buys on its own once a target price hits. Per Amazon, during Q2 2026, active users were almost double the previous year.
The strategy now runs as tech, on the platform that taught it.

Who Else Is in the Cart
The tooling tracks with the spending, as shown by Deloitte’s survey. Against a $557 average per student, parents using no digital research tools plan around $381, while those combining search, social, and generative AI plan around $737. The households delegating most are spending double.
And there is another seat at the table. Three in five parents now give their children access to the online cart. NRF puts the leverage in dollars: 62% of K-12 shoppers say at least half the season’s spending traces to their child’s influence. Another 13% plan to pay for AI tutoring or camps—a line item that appeared on no supply list two years ago.
So the purchase is now assembled by parent, student, and machine. One of them shops out of sight.
Expensive Shelf, Moving Shortlist
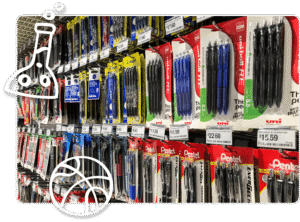 Meanwhile, the shelf has never been worth more.
In the U.S., retail media spend will reach $70 billion this year, with nearly 90% of incremental spending going to Amazon Ads and Walmart Connect, whose U.S. business grew 44% in FY27 Q1 (excluding Vizio). Amazon’s retail media revenues will surpass $75 billion by 2028. The average brand now works with six retail media networks and expects eight by year’s end.
Retail media—a channel that in 2019 was barely a quarter the size of the television market—crosses $200 billion globally this year, passing combined linear and connected TV (CTV). Measurability was the pitch: sales data attached to impressions, a loop linear couldn’t close.
WARC’s own read is that retail media excels at closing existing demand rather than brand building, which makes the agentic layer an awkward guest. Tinuiti sets out the disintermediation issue: When an agent brokers the purchase, fewer conventional slots exist inside the garden, and prior exposure shapes how often a brand surfaces in its answers. Brand building moves upstream, out of the channel brands just paid record rates to win.
And the Shortlist Isn’t Especially Loyal
Seventy-one percent of parents switch brands on price. And 37% of brand-loyal consumers would let an agent switch away from a favorite if it found a better fit. This is a shopper handing the decision to a system whose shortlist they don’t set.
Nobody Can Prove Much of It
NielsenIQ finds 67% of CMOs raising retail media investment, while only 53% believe their networks can support reliable incrementality measurement. The gap has a cause that NIQ names: Networks rarely permit the kind of controlled testing Meta and Google allow, so ROAS and last-touch fill the vacuum by default. Neither can tell you whether the sale would have happened anyway.
Which produces the season’s strangest posture: 70% of advertisers met or beat their retail media targets in 2025, while saying they lack the people and process to run incrementality. Winning by a number they don’t trust.
Nor is what’s underneath much help: Across advertising generally, only 10% of marketers call their adtech fully connected across channels. Nine in ten are buying across a stack they cannot see end to end.
The Counterfactual That’s Left
Return to that Sunday night at 11:40 when the backpack hit the target price.
Somewhere, a brand bids on the keyword. Somewhere, a retail media network serves an impression to the category. Somewhere, a CTV spot runs in a July back-to-school flight. On Monday morning, the sale appears in the dashboards, and nothing connects it to any of them. Zero-click synthesis breaks attribution before the click fires, and where UCP closes the sale inside Google’s own surfaces, the session, referral, and landing page an ad platform reads never surface.
Tinuiti frames the question: Did the agent decide, did it assist, or did it merely carry the transaction—and did any upstream spend shape what it recommended?
Last season’s problem was an impression the stack could see but couldn’t credit; stretch the lookback window and the credit finds its way home. This time, there’s no impression to stretch a window over.
The Visible Half Is Thriving
Reporting is appearing, sort of. Shopify’s agentic storefronts surface orders placed through ChatGPT, Copilot, and Google AI Mode, so the merchant can see which agent closes the sale. Google Analytics added an AI Assistant channel in May 2026, so the analyst gets a partial view. The merchant sees the agent-placed order, the analyst can kind of see it, and the advertiser who paid for the impression has no reporting surface to speak of.
Meanwhile, the visible half of AI commerce is performing beautifully. AI-referred traffic to U.S. retail sites converted 42% better than non-AI channels in March 2026, now the best-qualified traffic a retailer has. Although AI still accounts for under 1% of total web traffic, Q1 2026 traffic from AI sources to U.S. retail sites grew 393% year over year. The base is small (and growing); the blind spot isn’t. When the agent finishes the job inside the conversation, the retailer gets the sale and no visit.
Deliberation Moves; Fulfillment Doesn’t
This isn’t simply a migration from store to screen. College shoppers’ online-purchase intent sits at 41%, the lowest NRF has recorded since 2016, while about four in five purchases remain store-led. Deliberation has moved into the conversation. Fulfillment is staying on the shelf.
The List Doesn’t Care What You Spend
All of which puts marketers back where New York stood in 1997, with fewer ways around the question. Back to school is the purest organic-demand baseline in retail. What the agentic layer removes is the record that lets marketers avoid asking what the promotions are actually doing.
Back-to-School Incrementality Testing Doesn’t Need the Click
Incrementality testing doesn’t infer causation from a trail. It manufactures a comparison. Withhold the spend somewhere, run it everywhere else, read the difference: holdouts by geography, time, or cohort. The method survives the agent; it depends only on two comparable groups and one difference between them—or a modeled control standing in for a group you don’t withhold.
This season hands you the design. Some states hold a back-to-school sales tax holiday and their neighbors don’t. Amazon moved its event out of July, making this year’s promotional calendar a before-and-after against last year’s. Holiday states can be read against markets that don’t do the discount; the migrated promotional window can be read against the same weeks a year ago. The variation is sitting in the calendar.
Tinuiti’s read is that incrementality measurement “gets harder and more important”—harder because the journeys are opaque, more important because that’s the condition under which a controlled comparison is what’s left standing.
The Rest of the Stack
None of this argues for running only one instrument. Marketing mix modeling reads what individual tracking cannot, taking the aggregate season from market-level data with seasonality, pricing, competition, and the tax-holiday calendar in the model. Last-touch attribution keeps its operational lane, optimizing tactics where clicks still fire, and plenty still do.
Back to school is one long incrementality test, run every year whether or not anyone records the result. The choice is between running it deliberately or reading the spike and skipping the footnote.
What to Do Before the Season Closes
The season is still running, which means the design is still available.
Read the calendar while it’s open. Some states are running a back-to-school discount and their neighbors aren’t; Florida’s window closes August 20, and the college wave and Labor Day are still ahead.
Remember that ROAS cannot answer the incrementality question. A strong ROAS on a household that was going to buy anyway is a well-measured coincidence.
Strip the event dates before you read the number. A moved Prime Day put 15 points into one channel’s reported growth.
Ask what your retail media networks can prove. Back-to-school incrementality testing means geo-lift, in-market experiments, and performance data your own measurement partner can read.
Don’t assume you cannot afford to test. Google cut the minimum budget for an incrementality experiment from roughly $100,000 to $5,000 in November 2025, using Bayesian models that rely on less data.
What New York Knew
Twenty-nine years ago a state created a shopping ritual, measured it honestly, found it mostly moved demand around the calendar, and left the table.
Everybody else called their play. States discounted to stop the leakage. Retailers piled on. Amazon built a holiday, then moved it. Rivals counterprogrammed. Households learned to wait, then used AI to do the waiting for them. Every move deliberate (and answered), every move rational on its own terms.
NIQ points to one more rung: the brand side is delegating too. An agent running your retail media chases whatever number it’s handed, faster and more obediently than any team ever could. And the number most brands hand it is ROAS, which cannot parse a caused sale from a bought-anyway one.
So the endgame: a purchase decision made inside a conversation, on a machine’s shortlist, at 11:40 on a Sunday night, where no dashboard is standing—and a second machine, on the brand’s side, spending against a number the decision never touches.
The list on the refrigerator hasn’t changed. Two glue sticks. The 24-count crayons, not the 64. A backpack, no wheels. It will be filled this month, as it was in 1997, and the real question is still the one New York asked first:
How much of it would have been bought anyway?
The season’s question has an instrument.
Kochava Foundry, the strategic services division of Kochava, offers MediaLift®, providing third-party validated, independent lift measurement using proprietary synthetic control group modeling to separate true causal impact from simple correlation.
AIM (Always-On Incremental Measurement), Kochava’s MMM solution, measures the aggregate season around the tests, and last-touch attribution keeps you optimizing where clicks still fire. All in one login.
Self-service incrementality testing, part of the AIM platform, enables marketers to create, schedule, and run controlled on/off pulse tests from the dashboard, without a separate tool, agency, or data science team. Design one this week, and it reads out before Q4 planning starts.
Contact our team to find out what the counterfactual looks like for your season.