
The Kochava Fraud Console has three new ways for ad fraud detection. The views, Click Flooding, Time-to-Install (TTI) Outliers and TTI Distribution, are visualizations of flagged data for marketers to review.
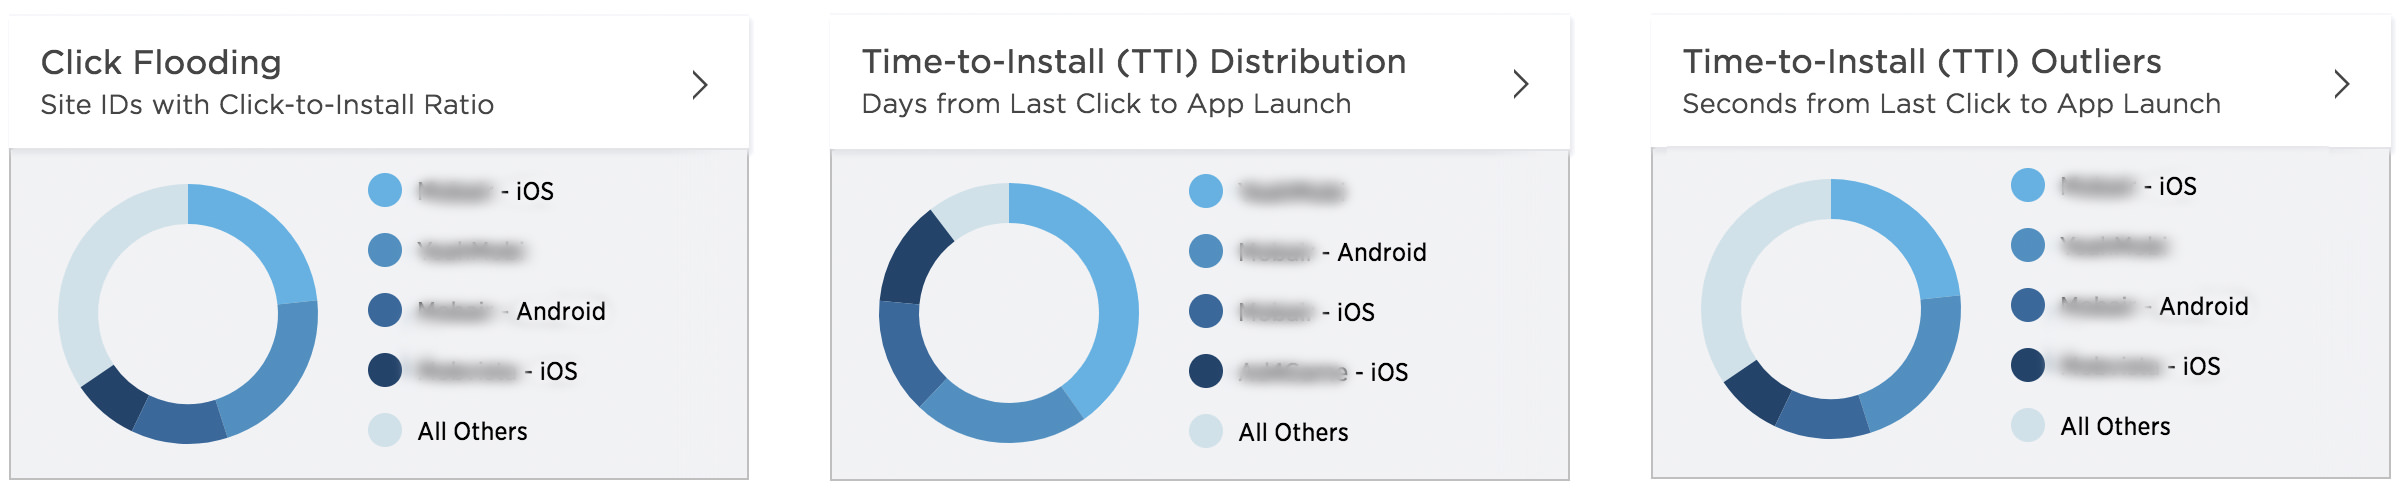
Click Flooding
Click flooding is one of the more common methods that fraudsters use to cheat the last-click attribution model. Since this model is still the standard in mobile, fraudsters have taken to flooding the ecosystem with clicks with the goal of squeezing these fraudulent clicks in before an install to claim attribution and get paid for that install.
Kochava has been doing click-flooding analysis for customers as a part of either a business value assessment (BVA) or Fraud Audit. Now, click flooding reports are available to every Kochava customer with access to Fraud Console. The click-flooding view shows any network or site ID (sub-publisher) with an unusually high click-to-install ratio.
TTI Outliers
Time to install (TTI) is an important indicator of install validity. The time between click and install is governed by physical factors (network speed, size of app binary, etc.) as well as behavioral factors (incentivized installs typically happen within a short time). Determining the mean TTI for your app on a given network and sub-publisher provides an important baseline from which deviation can be measured and flagged when it exceeds reasonable limits.
The TTI Outliers view indicates potentially fraudulent traffic based on the TTI. For example, when the time between click and install is less than 1 second, this is fraud, as it is physically not possible to handle a click redirect to an app store, and download and launch an app within a second. However, as that time increases, the likelihood that an install is fraudulent changes. Additionally, different network and sub-publisher combinations will have different TTI norms.
TTI Distribution
The distribution of TTI for a given campaign is another valuable indicator of fraud. For most campaigns, the majority of installs occur within the first few days of launch and then trail off as the campaign continues.
The TTI Distribution view shows the number of installs that occurred within a five-day window of the click or impression as well as the number of installs that occurred outside of that window. This visualization highlights cases where we see an inverse install distribution—proportionally more installs over time. This is a strong indicator of fraudulent activity.
Accessing these new views is easy. Simply log into your account and choose the Fraud Console from your account drop-down menu.
The suite of ad fraud detection tools offered by Kochava has already saved marketers millions of dollars. Still not convinced? Ask us about a Fraud Audit.