
Last Click Attribution is an Incentive for Mobile Ad Fraud
See Grant’s post as originally published on Medium. For an in-depth version of his thought-piece, see below.
As the digital advertising ecosystem becomes educated on mobile ad fraud, it’s important to understand that fraud comes from a variety of different angles. The majority of fraud is actually a side effect of the way attribution is performed. It is, interestingly enough, directly correlated to the predominance of mobile app install ads being priced on a CPI basis.
Roughly three-fourths of the fraud detected by Kochava is characterized as attribution fraud—where the install is legitimate, but fraudsters attempt to get credit for either organic traffic or installs driven by another network partner. Tactics to game the attribution system include click spamming, click stuffing, ad stacking, and many other techniques.
The remainder of the fraud we detect is ‘manufactured’, where the device or install itself is questionable. The inordinate majority, though, deals with publishers attempting to get credit where little or no credit is due. The tactics to game the attribution system here include click spamming, click stuffing, ad stacking, and many other techniques. If you’d like to explore the various algorithms we use to detect and prevent attribution fraud, I encourage you to read the previous posts in my Fraud Abatement Series. The purpose of this post, however, is to explore the incentives that lead to the remarkable amount of attribution fraud we’re seeing across the industry.
In my prior life, I led a team of measurement analysts focused on campaign performance at one of the largest software companies in the world. We strove to express performance in terms of incremental lift. This meant asking the question: Does touching a household with media have a measurable effect vs. an identical household that was not touched by media? Or: In the absence of an ad, how many people would have taken the action anyway? This post won’t detail the challenges around measuring incremental lift in digital (there are many) but instead will take the learnings from more sophisticated measurement techniques and apply them to direct-response mobile marketing.
First impressions matter
One of the more interesting artifacts from incremental research was how much lift was generated by impression. With enough data, it was possible to detail the incremental effect of the first, second, third impression, etc. Invariably, the first impression does the most ‘work’ in influencing behavior. This makes sense when the customer has no prior engagement with the brand. It’s reasonable that the first time the user is exposed to an offer has the most effect.
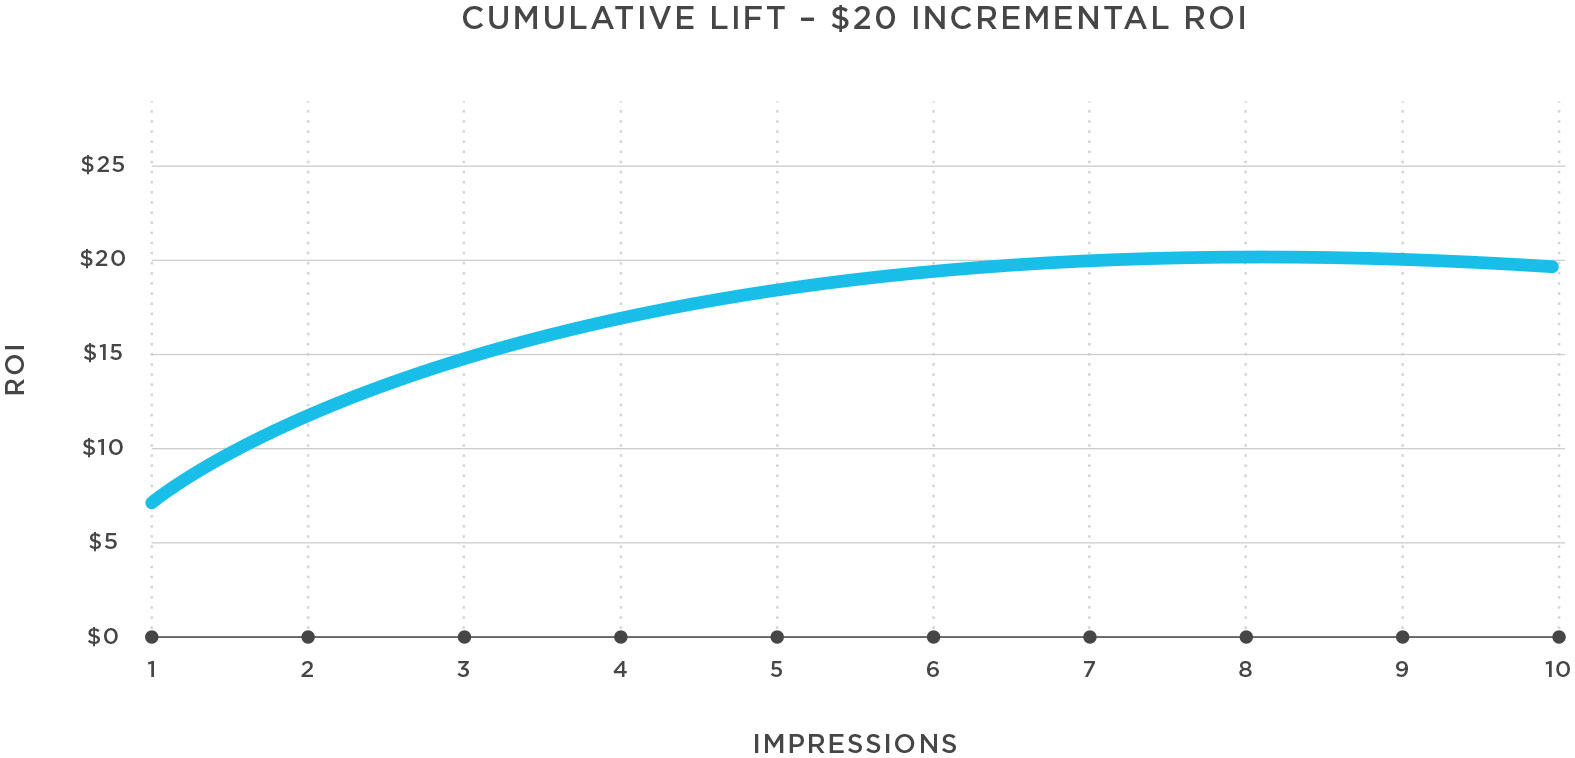
Additional marketing touches are influential, however; while the first impression is the most important, it often takes multiple cumulative impressions to get someone to ‘pull the trigger’ and convert.
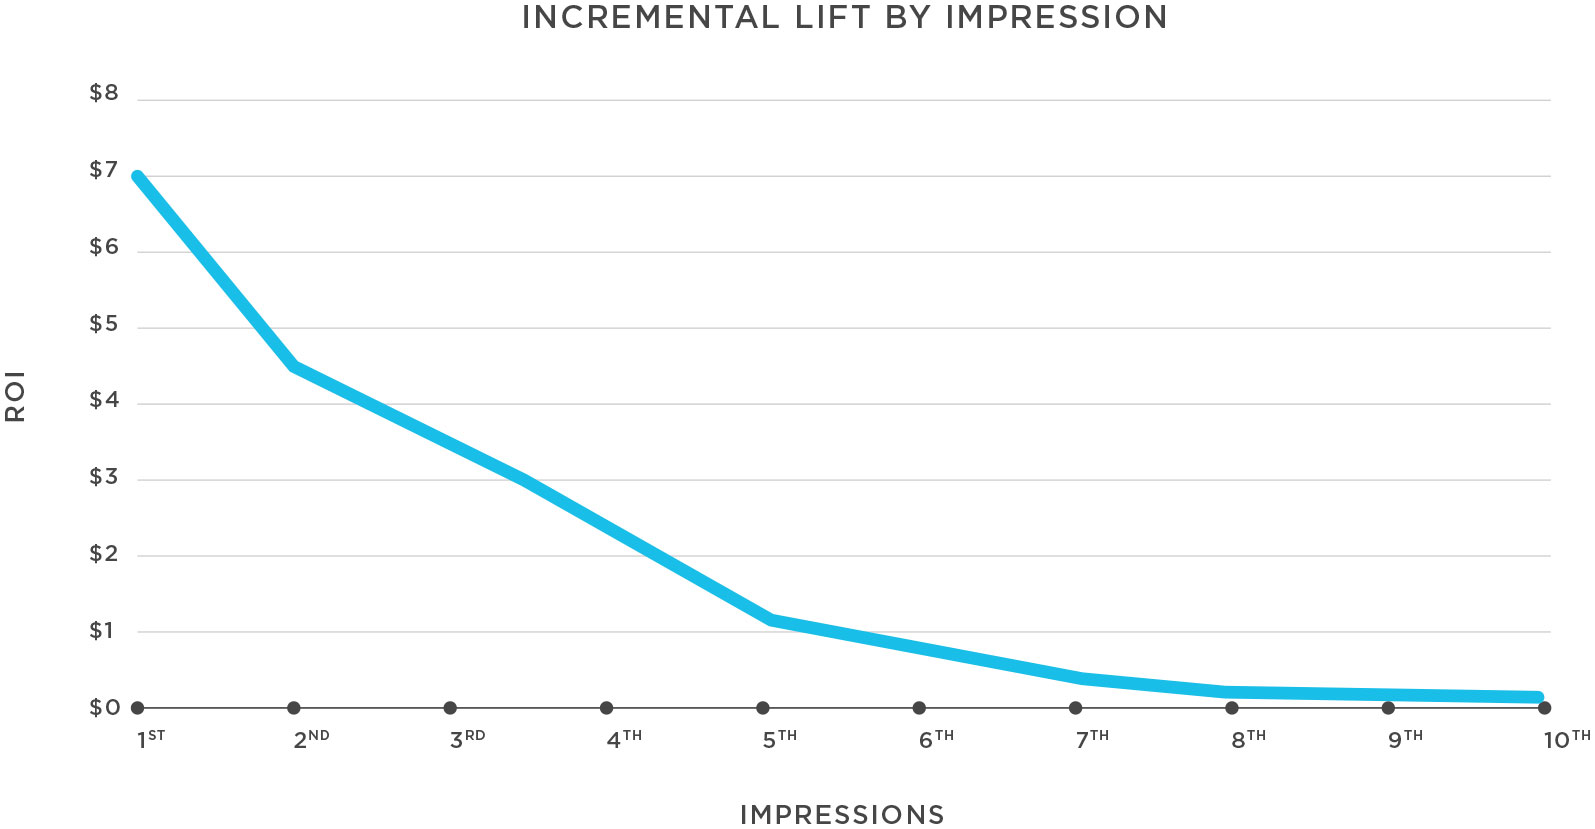
In the first graph, the overall lift for this campaign was $20. This was a cumulative lift based on impressions 1 through 5. In the second graph, when we calculate the delta between each impression, we see that the first impression had the most lift.
What does incremental lift by impression have to do with direct response marketing with the intent of driving app downloads? And, how does this relate to the amount of fraud we’re observing?
The short answer: Networks are incentivized to have the last click, not to reach the most prospects. While the networks should be maximizing their reach in making those valuable first impressions, networks instead focus on frequency in order to win the last click.
Where no lift was observed, we often found that the ads weren’t viewable. Also, partners like Moat Analytics or Integral Ad Science (IAS) provided clues as to whether the impression was even seen by a human. In desktop/web marketing, that was as far as we’d go for fraud detection.
Viewability of mobile ads is certainly important but difficult to implement, particularly in-app. Also, the mobile app world as a whole does not account for impressions, so whether the ad is viewable or not, ingesting impression data is generally the exception to the rule.
Last click may not be the most influential
Direct response attribution has largely been borne from the demand for nearly instant feedback loops. Marketers—particularly the large ones—have demanded that advertising networks attenuate to signals in real time and adjust the ad mix accordingly. In order to have instant feedback, an install needs to be instantly adorned and posted back to the ‘winning’ network. To determine the last click, there is a waterfall hierarchy. For instance, a device ID match has higher integrity than user agent with IP, along with the ability to adjust the attribution window to what the marketer deems reasonable. However, the bulk of matched winners rely on last click attribution.
Determining attribution based on the last click casts a blind eye to the valuable touchpoints preceding it. A potential prospect may have viewed an ad on Facebook, watched 30 seconds of an advertising video on YouTube, played a minigame promoting the target app inside of a game already installed, and clicked a static banner in their web browser. In this scenario, the install will have been attributed to the last click interaction, but it’s reasonable to believe that each of the media touchpoints played a part in converting the prospect. So, where should a network put their efforts?
With upper-funnel user acquisition, the marketer is most benefited by maximized reach: To serve as many first impressions as possible to the largest possible population of prospects. But the network incentive is to have the last click, so instead of maximizing reach, the dollars lie in maximizing frequency. The industry has created an incentivization framework that keeps networks from doing what they should be best at. This has resulted in networks with the click spamming and attribution fraud everyone is witnessing.
Industry perceptions of attribution must change
All of this is to say that the attribution model should be improved to better reflect the most influential touchpoints prior to the install. There is value in collecting all of the touchpoints leading to an install, but collecting all the data is the hard part. While the measurement framework may not be ideal, the necessary elements are in place to improve. Here’s where I see opportunities for improvement:
1. All networks should pass both impressions and clicks. There is a ton of value in understanding not only who’s clicked an advertisement, but who’s been reached at all. To some extent, an impression does some amount of ‘work’ in the path to conversion, and we can’t account for it if we don’t have it.
2. As an industry, we should have the ability to ingest ad types, sizes, and consumption metrics, and to standardize the ad data. It’s a reasonable assumption that video ads do more work than static banners, or that one minute of video watched does more work than five seconds, tracking those details is imperative.
3. Marketers should use fractional attribution. Fractional attribution offers the ability to assign an increased or decreased weight on the value of a network’s traffic. While few marketers consider using fractional attribution, Kochava customers can fractionally allocate attribution credit or even use multi-touch attribution (MTA) models. They can assign more weight to video view-throughs, for instance, even when the video view wasn’t the terminal action in the path to download.
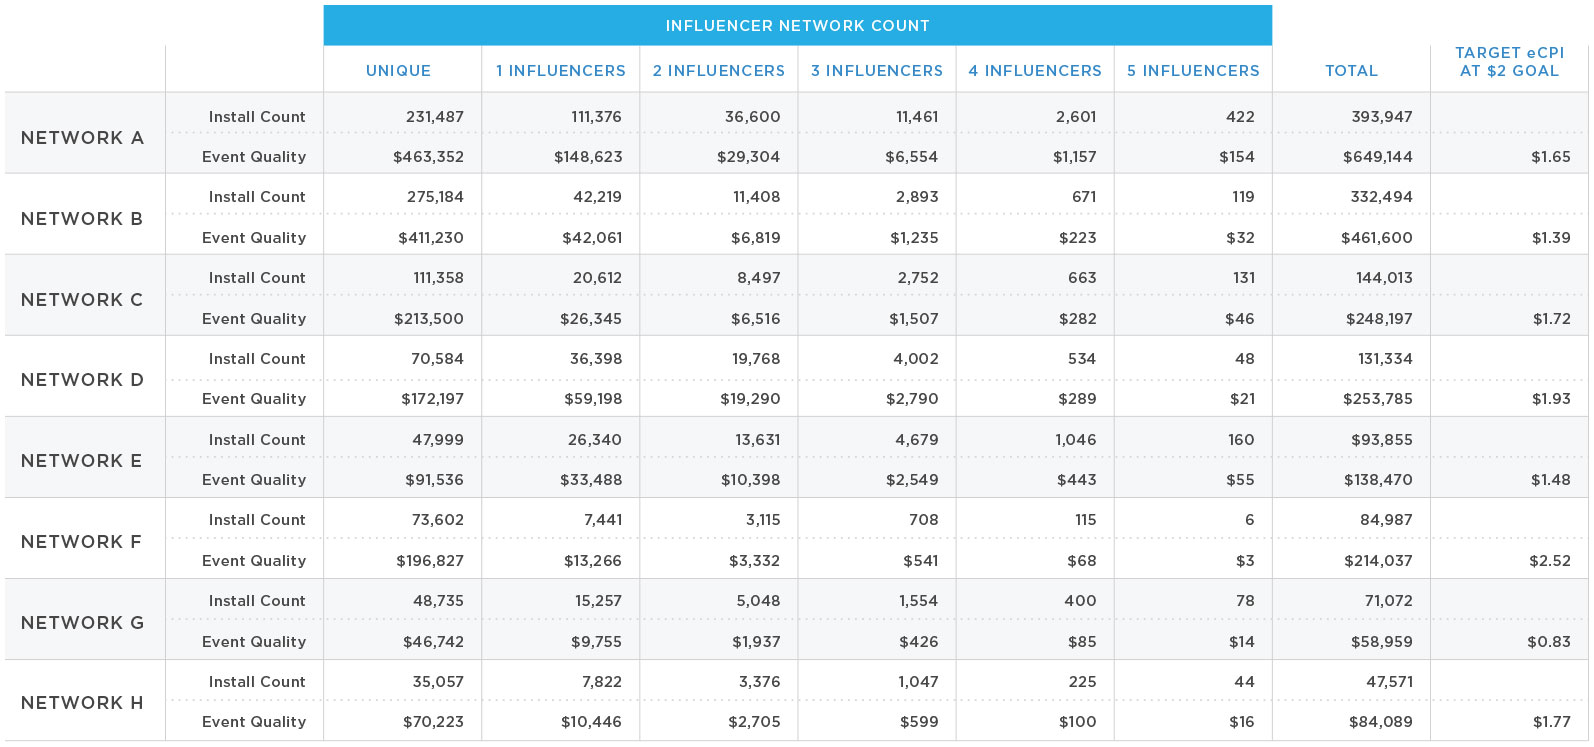
In the graph below, the networks are segmented by their overall uniqueness and the dollar value (quality) of their attributed installs by how many other influencers were involved (1-5). The purpose of the model is to estimate how much a marketer would pay for a unique, target install. For example, if Network A had a total of 231,487 unique installs, the marketer would pay $463,352 ($0.50 cost per install). That amount decreases as the number of influencers increases. Moving forward, marketers can set a target and use uniqueness and quality (amount of revenue generated) of installs to weight attribution per network, thus, moving away from last-click attribution to one network. In some cases, the marketer might be paying more for traffic, but it would be more unique and higher quality.
An example of MTA rewarding uniqueness and quality is shown below:
While MTA models aren’t perfect, they are a step in the right direction. They won’t eliminate fraud, but being able to see impression volumes and ad types allows marketers to make better decisions. At Kochava, we’re working on creating more precise MTA measurement than what I’ve described above, and I anticipate we’ll have some in-market examples in the coming months.
4. Measuring incremental lift generated from an ad unit is the ideal. But, incremental measurement is remarkably difficult and expensive in digital, and even more so in mobile. The results are often inconclusive, even in a perfectly executed campaign.
If attribution is about finding the channels that drove an install, then we need to consider more touchpoints outside of the last click.
About the Author
Grant Simmons is the Director of Client Analytics at Kochava and leads the team in analyzing campaign performance and business value assessments. He is the former head of Retail Analytics at Oracle Data Cloud where he worked with over 1,500 retail directors, VPs, CMOs and agencies to develop individualized test-and-learn strategies.