
Today’s marketer is data-driven. More than simply connecting our clients with their data, Kochava seeks to empower strategic decisions through marketing intelligence. Our growing Client Analytics team is comprised of data analysts who work hand-in-hand with clients, delivering face-to-face business value assessments (BVAs) and quarterly business reviews (QBRs) that inform, educate and empower UA managers, CMOs and other decision makers to position their brands for success.
In this series, members of our Client Analytics team will explore marketing intelligence insights available to our customers from the tools Kochava provides.
Nearly 70% of mobile users churn within 90 days. With this in mind, how do you keep the users you find? Predictive behavior modeling was developed by Kochava data science and engineering teams to help clients predict the churn of a user before it happens. This data empowers marketers to improve retention rates and navigate strategy toward better return on investment (ROI).
How predictive behavior modeling works
After a new install, our machine learning algorithms go to work using a form of decision tree modeling to analyze recency, frequency, trend metrics, and other data variables during the first 7 days of a user’s interactions with the app.
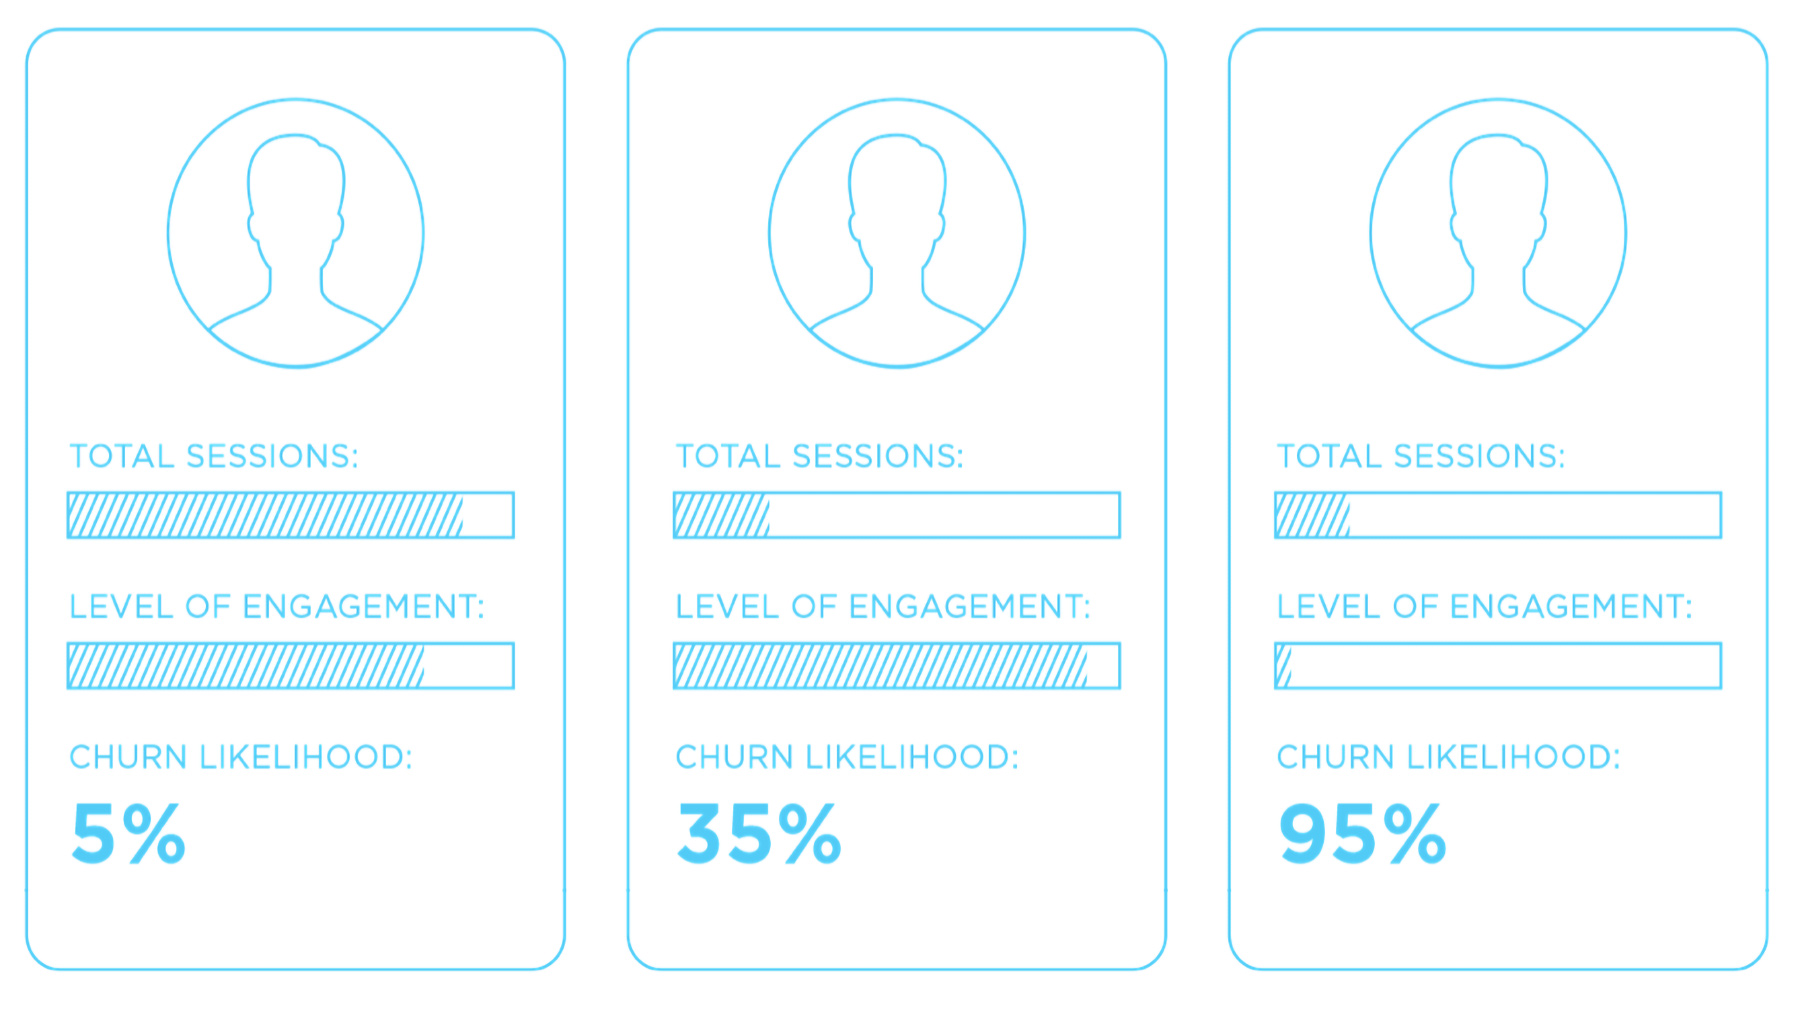
On day 8, the user is assigned a churn score. “Churn” in this case means how likely is the device to not have activity in the app between day 8 and day 38 after install.
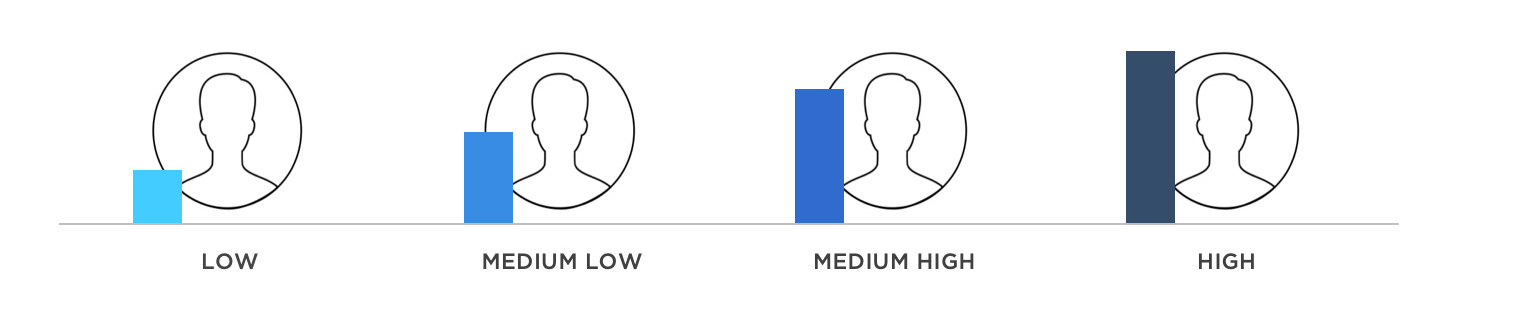
A user with a score of “Low” indicates that it’s likely they will have further engagement with the app between day 8 and day 38. A user with a score of “High” indicates that it’s likely they will churn, or have no further activity in the app between day 8 and day 38.
Determining prediction accuracy
Predictions are only as good as their ability to accurately forecast. Assessing the accuracy of the predicted churn scores from the machine-learning model required analysis of the downstream activity for each churn group to see how closely the predictions aligned with the outcome.
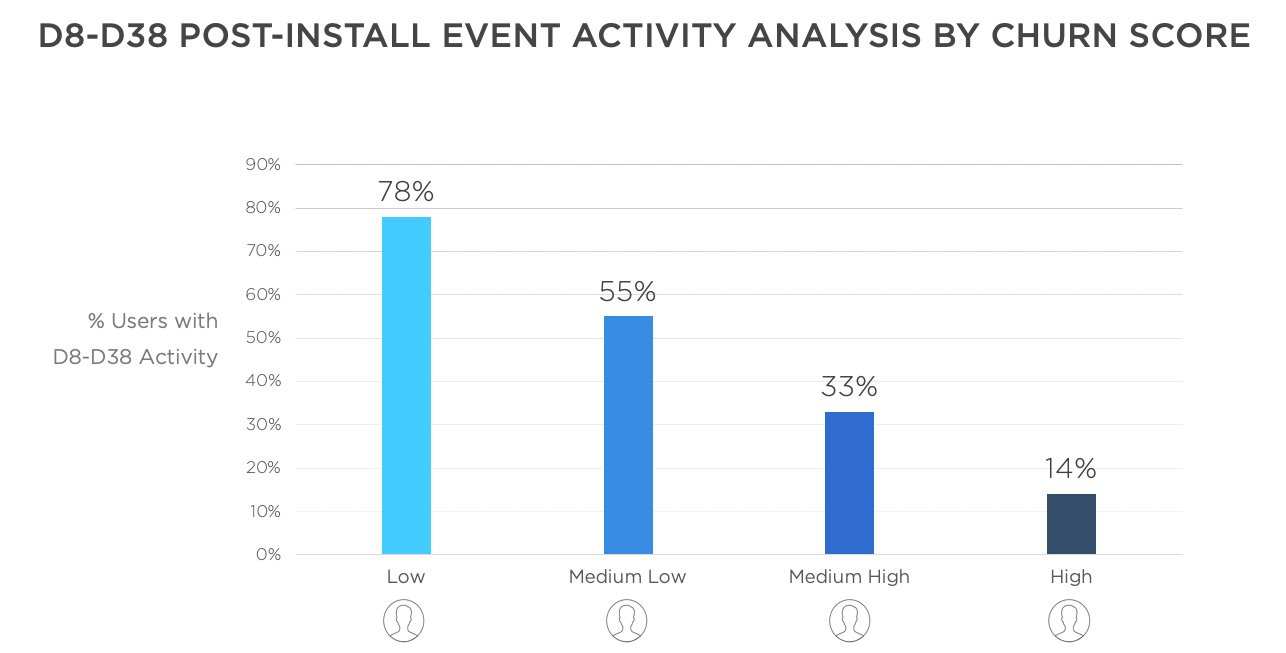
Through extensive examination of multiple data sets and applications across various verticals, a common trend line emerged. With overwhelming consistency, users adorned with “Low” churn likelihood scores displayed the highest percentage of session and in-app event activity between day 8 and day 38 post install. Users scored at “Medium Low,” “Medium High,” and “High” exhibited an exponential decline in engagement over that period. With prediction accuracy confirmed and aligned with expectations, these churn scores provide valuable, actionable intel.
Applying predictive behavior modeling
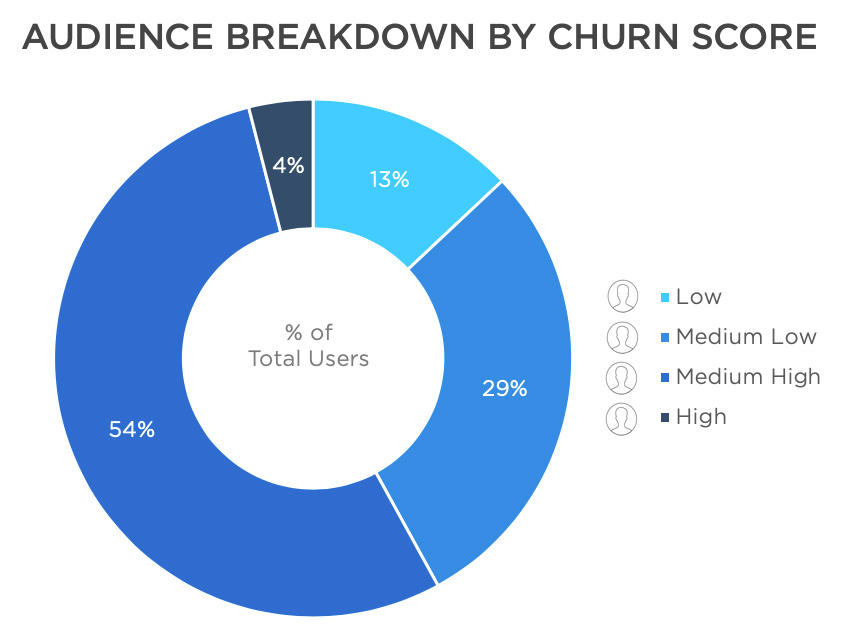
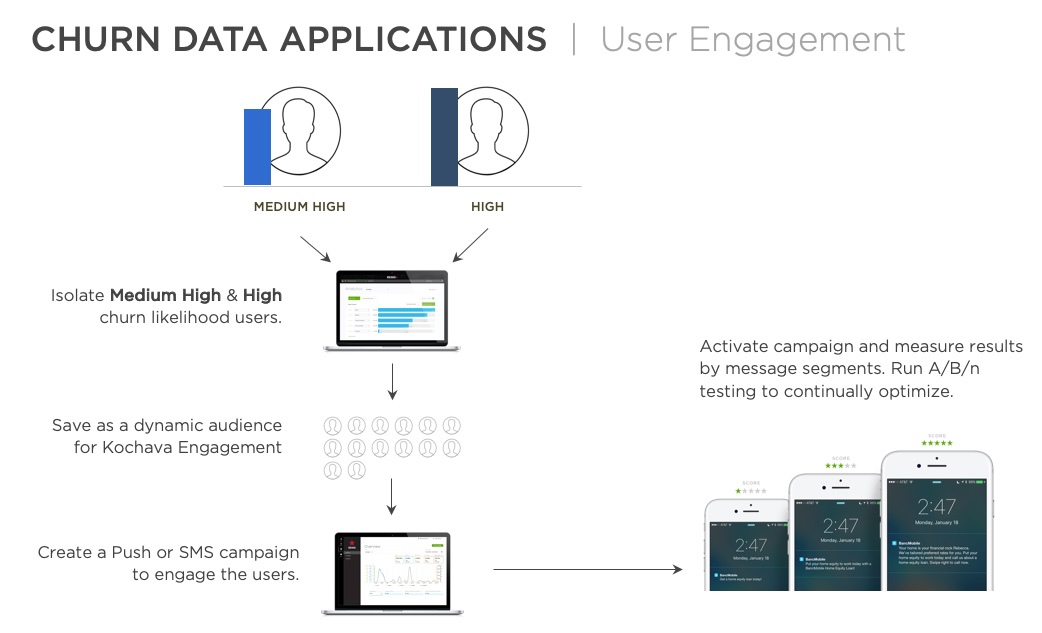
Providing advanced insight into a user’s likelihood for attrition allows marketers to strategically intercept that user with targeted reengagement efforts. Using analytics, marketers can segment audiences according to churn-likelihood scores and syndicate “Medium High” and/or “High” likelihood segments to reengagement partners like Kochava for focused targeting campaigns to drive retention.
Marketers can build dynamic audiences around churn scores and set triggered push campaigns with contextually relevant, dynamic content to promote user retention and growth.
User audiences with a “Low” churn likelihood can be valuable seed audiences from which to build lookalike models to attract quality users with similar characteristics that promote user longevity and loyalty.
Predicted churn data also informs insights into media partner quality. Brands are leveraging audience breakdown by partner based on churn score distributions. They can deprioritize partners that over-index in users with high likelihood for churn, and focus on partners who consistently deliver users with low churn likelihood and a higher ROI.
Maintain user retention
Predicted behavior modeling offers turnkey marketing intelligence with meaningful actionability. Reengage users most likely to churn with custom messaging via push notifications. Apply audience segments with a low likelihood for churn to create lookalike audiences of high-value users. Or, compare media partners and identify which ones deliver quality users least likely to churn.
To learn more about Kochava Predictive Behavior Modeling and how it can help your marketing efforts, contact your client success manager or support@kochava.com.
Not a Kochava customer? Contact Us today.

Kochava