How fandom cohort attribution, consented location intelligence, and MMM turn 135,000 fans into a measurable media signal
TL;DR Summary
Comic-Con 2026’s 135,000 badge holders begin their customer journey weeks before the event, forming communities on Discord, Reddit, and creator channels that traditional attribution doesn’t see. Rather than the individual touchpoint, Comic-Con marketing measurement reframes the Fandom Cohort—the self-assembled fan community—as the unit of analysis, tracing a three-phase arc of formation, activation, and propagation. Consented signals including QR scans, stamp rallies, and creator affiliate links make physical fan behavior attributable by construction, while marketing mix modeling reads the aggregate movement that individual tracking misses. The result: fandom lifetime value becomes a measurable, compounding metric rather than a one-weekend guess.
 Nine days until San Diego Comic-Con, and the crowd has already assembled. Not on Harbor Drive, but everywhere else. A Discord server runs round-the-clock theory shifts on the Percy Jackson and the Olympians activation Disney announced July 9, debating which of the branching paths—Percy’s, Annabeth’s, or Thalia’s—hides the Season 3 reveal. On r/SDCC, the exclusives thread processes every press release like a wire desk, while three posts down, someone’s Gandalf staff enters the structural-integrity phase of its build. A shared spreadsheet of booth drops—color-coded, timestamped, lovingly maintained by strangers—sits open in a few thousand browser tabs.
No one organized this crowd, and no media plan conjured it. It gathered on its own. The roughly 135,000 badges the convention center holds were snapped up instantly, with the tranche for returning registrants selling out in 90 minutes. This is demand that, as noted by a San Diego State economist a week before the July 23–26 event, never blinked even as discretionary spending tightened elsewhere. And the entity the badges admit you to has been in session since spring.
Every person in this scene has opted in: joined the server, subscribed to the thread, registered for the drop. When the doors open July 22 for preview night, the signal densifies—onto the exhibit floor, into the Gaslamp Quarter downtown. And somewhere in a marketing office, a dashboard starts counting…
Here are the questions the dashboard isn’t built to answer: If the journey starts on Discord in June, where does the attribution window open? If the community does the persuading, who gets the credit? And if the relationship runs con to con, year after year, what does a fan end up being worth? The purchase completing in August begins as a theory shift in a channel the brand doesn’t create and can’t see. Badges don’t convert. Communities do.
Field Guide
San Diego Comic-Con is North America’s flagship pop-culture convention: 4+ days each July when 135,000 badge holders, plus a much larger badge-free crowd, converge on downtown San Diego. The Gaslamp Quarter is the adjacent district brands annually transform with free, public activations. Hall H is the cavernous hall where studios premiere trailers to fans who must camp overnight for seats. An Easter egg is a clue planted by a brand for fans to find and collectively solve. An exclusive drop is convention-only merchandise, gone by Sunday. Cosplay is costume fandom, often hundreds of build-hours deep.
Every one of these rituals is a time-stamped, measurable behavior. (Hold that thought.)
How a Specialty Gathering Became a Performance Media Channel
Comic-Con began in 1970, when a crew of teenage comics dealers and a fan named Shel Dorf drew some 300 people—including a couple of guests named Ray Bradbury and Jack Kirby—to the basement of San Diego’s U.S. Grant Hotel. The 2026 edition is one of the premier conventions of its kind in the world: 1,200+ exhibitors across 460,000+ square feet, generating upward of $160 million in regional economic impact. The audience scaled with the IP: YouGov’s July 2024 survey found that fully 32% of US adults express interest in Comic-Con, a surprisingly broad slice for an event whose reputation implies niche hobbyist gathering. Movies are the top driver at 62%, with television and video games close behind; comics rank fifth at the convention that bears their name. The Marvel Cinematic Universe and streaming wars made fandom the entertainment economy’s load-bearing wall; Discord, Reddit, and TikTok made it permanent, year-round infrastructure.
The advertising market has noticed. The con’s physical footprint is now priced as media inventory: Alluvit Media sells a dedicated Comic-Con 2026 out-of-home package, and SponsorUnited documents more than 165 brands active in San Diego OOH—Paramount+, Prime Video, FX, Marvel Studios, and HBO Max among the event’s heaviest users. The default measurement instrument for such physical activity is the event geofence. Vendors such as Qujam and Propellant Media describe the mechanics: Draw a polygon around the venue, capture the device IDs of anyone who crosses it, retarget for up to 30 days.
Judged on its own terms, the polygon is a leaky instrument. Qujam’s 2026 guidance puts capture rates anywhere from 5–70%, contingent on Location Services being enabled and degraded by exactly the kind of multistory concrete structure a convention center is. What it does capture is anonymous, decays in 30 days, carries neither identity nor relationship. A polygon can log that a device entered a building. It cannot know the device belongs to someone who spent 6 weeks solving Easter eggs to get there. A stormtrooper strides past in full armor, and the dashboard dutifully records foot traffic: 1.
Fandom Cohort
A higher-fidelity signal is available and has in fact been broadcasting since spring. Call it the Fandom Cohort: a behavioral unit defined by shared community activity across a traceable three-phase arc.
Formation unfolds in the weeks before the event: Discord servers activate, Reddit threads coordinate, Easter eggs get solved, wishlists build. Activation is the event window itself: booth visits, exclusive drops, stamp mechanics, cosplay-fueled user-generated content (UGC)—signal densifying across the exhibit floor and Gaslamp Quarter simultaneously. Propagation runs for weeks afterward: UGC reach, sentiment velocity, downstream conversion. Often the strongest signal arrives after the con closes.
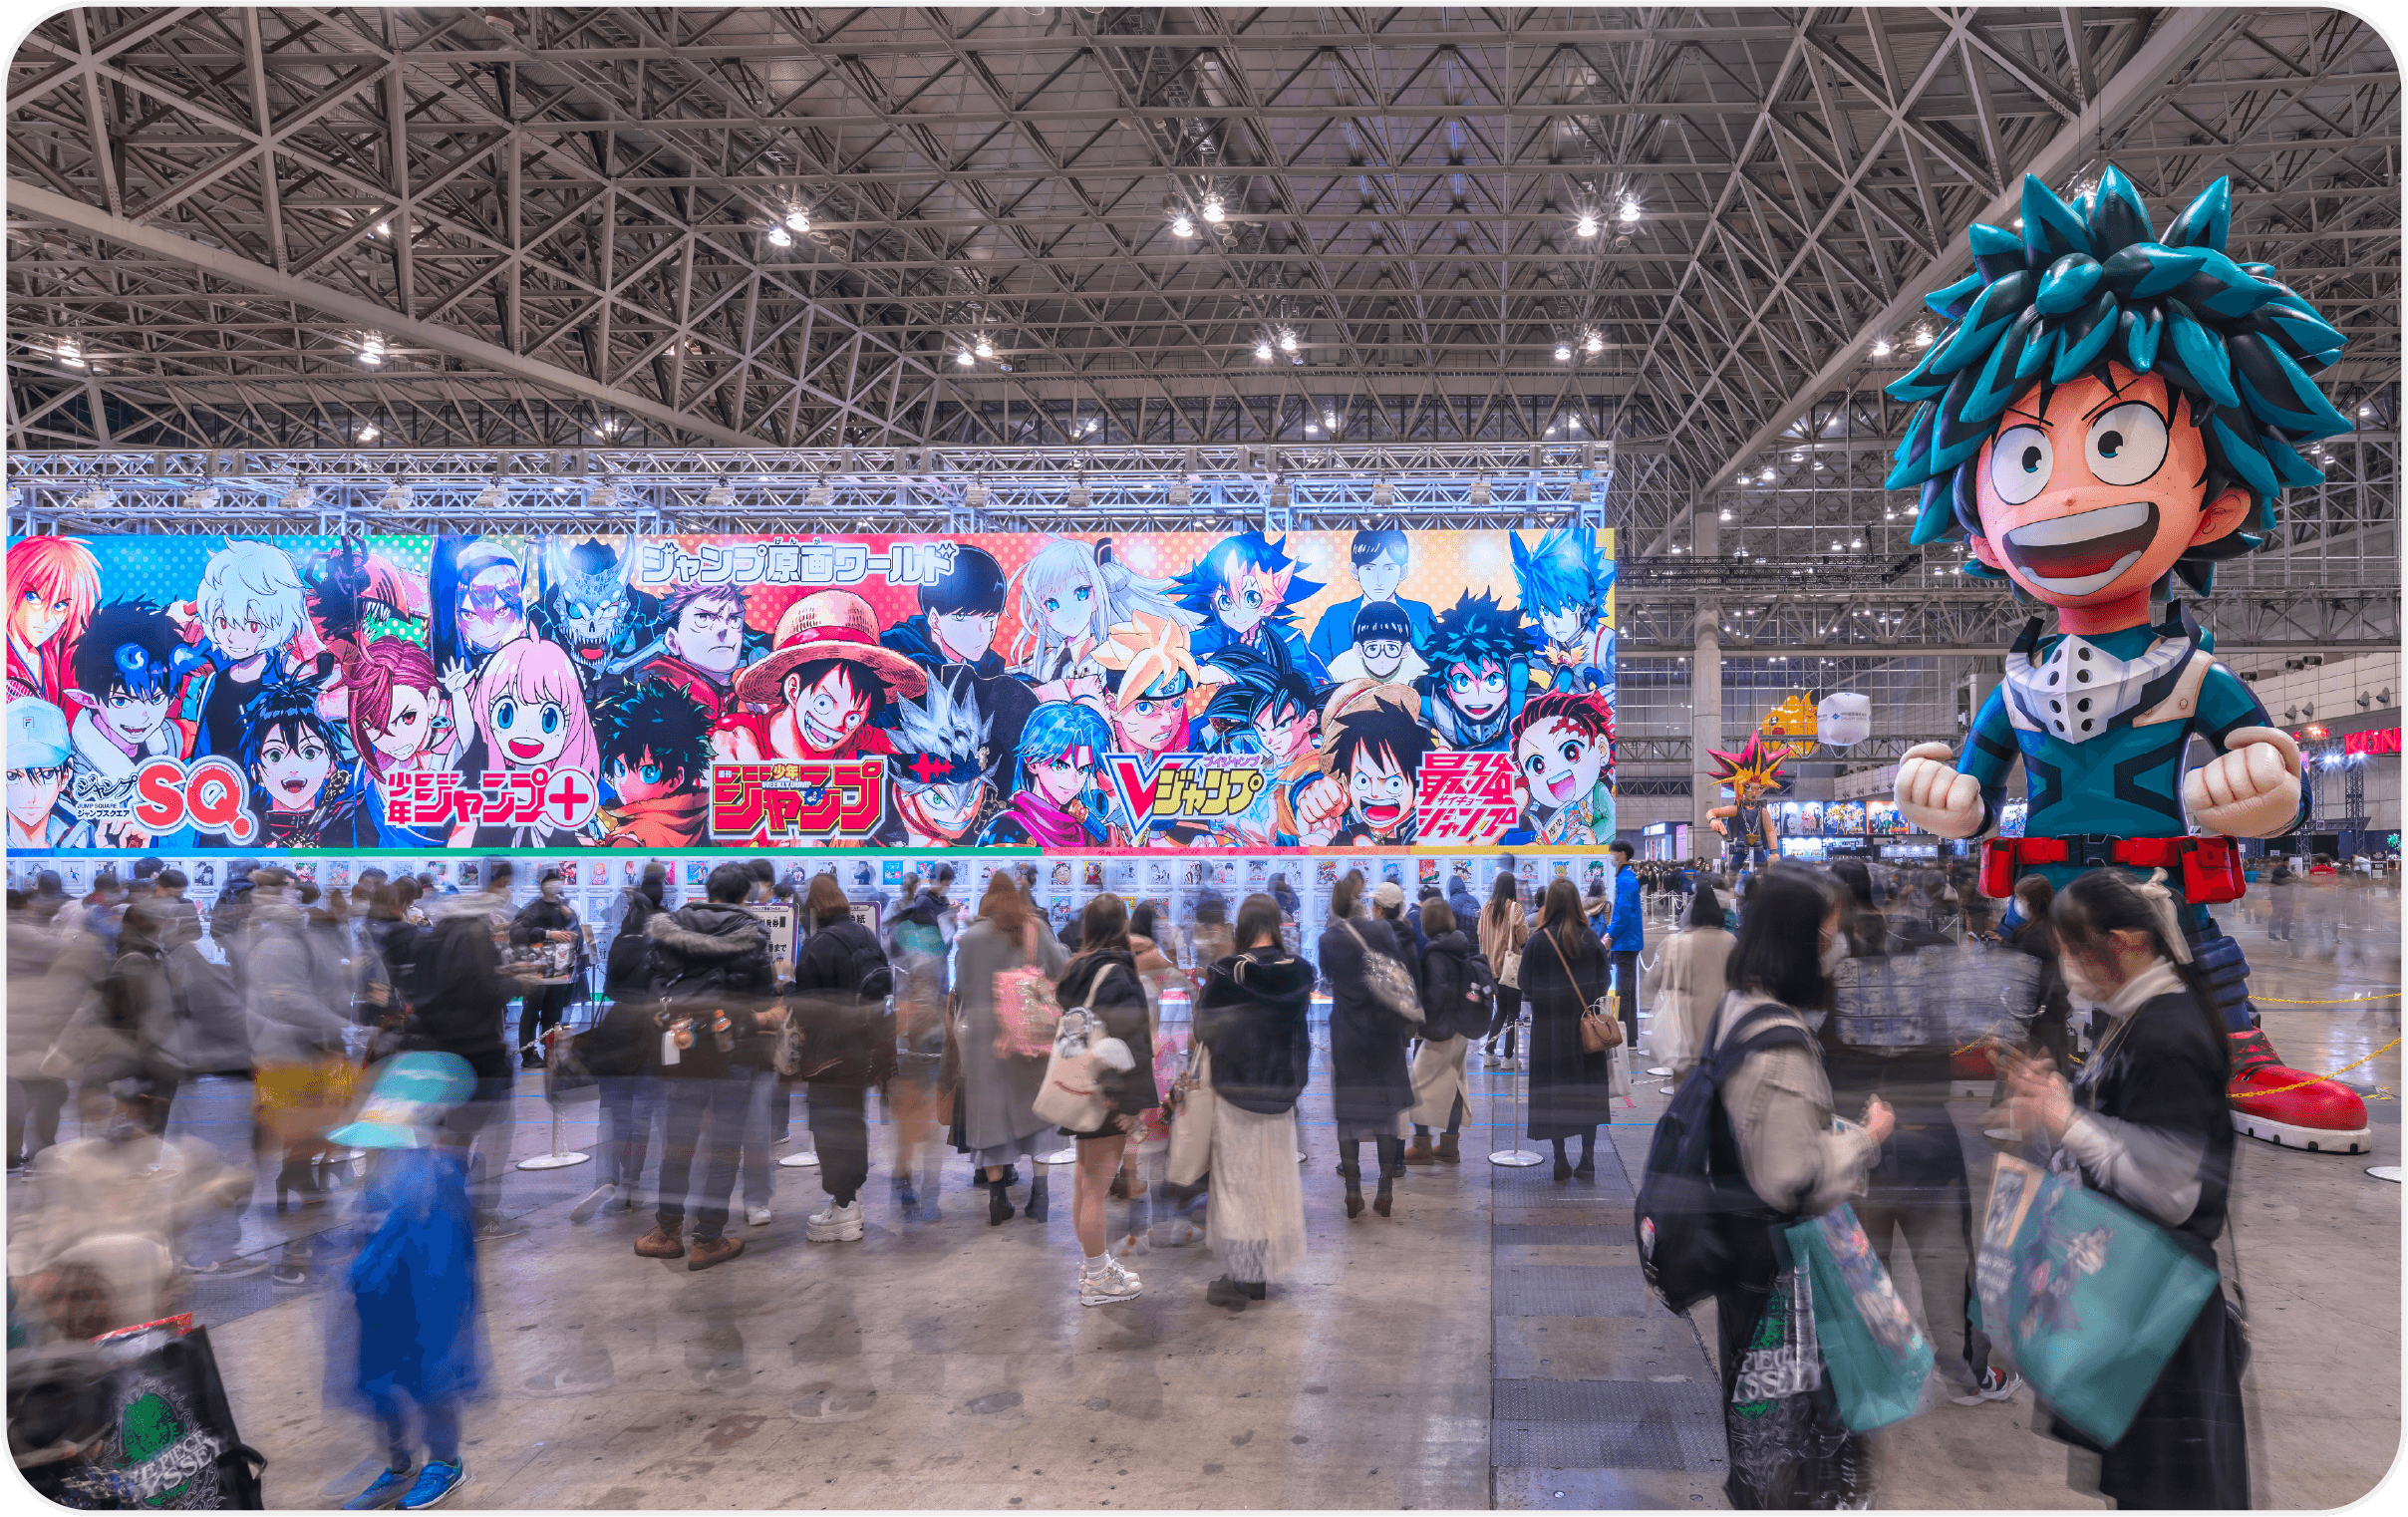
The structural claim: Make the cohort the unit of analysis—rather than the individual touchpoint—and the attribution window expands on both ends, as does what you can prove. The June drop registration, an orphaned email capture under the old lens, becomes the opening of a journey; the August merch order, formerly “direct traffic,” becomes its completion. And conversion runs well past the merch table. For the studios and streamers who dominate the con’s ad footprint, it’s the subscription started for a premiere, the season tuned into, the ticket presale. For publishers and toy makers, the preorder and collectible; for game studios, the wishlist add that converts at launch.
Research supports the cohort reframe. Ogilvy finds that 86% of Gen Z are fans of something, and 81% of Gens Z and Alpha prefer identification by interests over traditional demographics. The cohort is how these fans already see themselves. Deloitte’s 2026 Digital Media Trends frames fandom as an always-on relationship, floating “fandom lifetime value” as a metric for the long-term economic potential of fan communities. And crucially, the cohort is consented at every layer. Nobody in it was captured; everybody joined. Brands measure the communities that assemble around them, and every signal inside the cohort is handed over. The resolvable moment arrives when a fan volunteers an identifier: the email gating the drop or QR scan at the booth. Where the geofence leaks and decays, the cohort endures, because the relationship is real.
Measuring a Fandom Cohort
When activation arrives on July 22, signal is everywhere at once: stamp cards filling booth by booth, QR scans firing at the drop tables, a near-20-foot Slime Surge feeding a thousand camera rolls, the Gaslamp running its branching paths. Reading it all takes four pillars, each with a proof point on the ground.
Community cohort attribution: The precedent proving the signal exists: At the virtual Comic-Con of 2021, Jack in the Box launched a branded Discord server as a con afterparty. Marketing Dive reported 5,560 members in the first 24 hours—more than 5X Discord’s benchmark for branded launches—and 27,000+ messages across channels the fans sorted themselves into: Marvel vs. DC, Funko Pop, product leaks. The audience segmented itself, inside a server it chose to join. This is cohort architecture, handed over voluntarily, and it was measurable in 2021 with tooling far cruder than we have today.
Creator partnerships as performance spend: “The most significant trend will be the holistic integration of the creator into the core marketing engine, which will see the traditional lines between ‘brand’ and ‘performance’ budgets finally blur,” says Sanchit Sareen, RVP of Influencers & Creators at impact.com, whose 2026 Influencer Marketing Trends report finds 74% of brands moving budget into creator programs as core strategy. Compensation has followed, with hybrid models tying the creator’s incentive directly to conversion. Engagement data tells a similar story: Smaller creators with devoted niche followings consistently outperform celebrity-scale accounts, posting 2–5X the engagement rate, corroborated across multiple industry trackers. On the floor, that’s the cosplayer with 40,000 devoted followers hosting a booth meet-up. Hand her a trackable affiliate link, and the meet-up becomes performance media.
 Consented location intelligence: The mechanic scales from handbuilt to citywide. At the small end, British comics institution 2000 AD (the anthology giving the world Judge Dredd) runs a stamp rally: collect stamps across three exhibitor booths—Rebellion, Nacelle, and Oni Press—to unlock one of 500 limited-edition art prints. This is a location-triggered conversion funnel fans complete on purpose, every checkpoint a fan announcing I am here, and I want this. At the large end, DC’s Unlock DC hub, announced in early July, runs across the whole city: Fans sign up, then scan their way through DC checkpoints scattered from the exhibit floor into downtown, climbing reward tiers toward a payoff with a catch: the DC Reward Truck where prizes get collected parks at a spot disclosed only to registrants. The relationship is literally the map. Nickelodeon applies the same logic as a dual footprint—a Fun-Ergy Factory booth inside the hall, a free public activation at the New Children’s Museum downtown—serving a crowd that extends well beyond the badge count.
UGC sentiment modeling: The success metrics themselves are shifting under the industry’s feet. EventTrack 2026, surveying more than 1,000 Fortune 1000 marketers, reports that consumer-event marketers now rank leads and captured data above foot traffic when defining success. Bolt PR’s Comic-Con guide measures a successful convention through UGC reach, post-event sentiment, and fandom-to-customer pipeline acceleration; the badge-scan count doesn’t make its list.
And the measurement is more tractable than it looks. UGC volume and sentiment velocity lead the sequence: The sharing comes before the buying. Trackable links traveling inside fan posts keep earned sharing attributable wherever it lands: The haul photo that sells a print run is a measurable event, not a happy accident. And the post-close UGC wave is aggregate movement by nature, exactly the signal the modeling layer downstream is built to read. Propagation is where ROI lives, and it’s precisely the phase where most measurement stacks switch off.
San Diego Is One Node
The model keeps traveling beyond one waterfront convention center. New York Comic Con draws upward of 200,000 attendees; Anime Expo tops 100,000 in Los Angeles. ReedPop, operator of NYCC and 20+ other conventions, has logged 1.6 million engagements across its flagship events on the Komo platform. The budgets are following: EventTrack 2026 finds 84% of consumer marketers increasing event spend this year. The model follows the behavior, not the genre. A Fandom Cohort assembles around anime in Los Angeles through the same arc it follows around Judge Dredd in San Diego.
The calendar turns the framework into a flywheel. Propagation from San Diego in July feeds formation for New York in October; the fan who scans a QR code in the Gaslamp carries her cohort membership—and identifiers—to the next city and the next year. Measured this way, Deloitte’s fandom LTV transforms from hypothetical into the natural unit of account: one relationship compounding across a circuit that never fully closes, rather than what one activation earns over one weekend.
The Measurement Has to Exist Before the Badges Drop
Comic-Con marketing measurement underscores an industry-wide gap. IAB’s State of Data 2026 reports that up to 75% of buy-side leaders say their measurement underperforms on rigor, timeliness, trust, and efficiency simultaneously, flagging the physical-digital boundary as one of measurement’s most persistent unsolved problems. Nielsen’s 2025 Annual Marketing Report finds only 32% of marketers measuring holistically across digital and traditional channels. Closing the gap is mostly a matter of the right architecture, in place early.
The architecture is mostly familiar functions arranged in the right order. Identity resolution built on handed-over identifiers—the email gating the June drop registration, app login behind the July booth redemption, loyalty ID on the August merch purchase—resolves one fan into one journey, consent captured and auditable at every step. QR codes and deep links make the physical moment attributable by construction: The fan performs the scan. Lookback windows stretched to match the arc keep June’s registration and August’s order in the same story, and LTV measurement across purchases and subscriptions gives Deloitte’s fandom lifetime value its arithmetic.
Two fans walk through the same Gaslamp activation. One scans the QR code and subscribes that night, an individually attributable journey because she hands over the thread at both ends. The other scans nothing, loves it anyway, and then subscribes a week later from his couch after a quick search. At the individual level he’s invisible, and the framework doesn’t pretend otherwise. He surfaces one layer up.
Where above it all sits marketing mix modeling (MMM). And such a tentpole as Comic-Con is pretty much the methodology’s ideal use case, for three reasons. First, the fans are already coming: Organic demand predates every media dollar at a fandom event, so the relevant question becomes What did your activation change?—an incrementality question MMM answers at the portfolio level. Second, con week fires everything at once—OOH, booths, creators, earned social—a concurrent-exposure tangle that defeats last-touch logic but is precisely what MMM is built to unsnarl. Third, the unit of analysis matches the unit of measurement: The Fandom Cohort is an aggregate; MMM reads aggregate movement—the badge-free Gaslamp crowd, the UGC wave that lands after the hall closes—from market-level data, with no individual tracking. The consent spine holds from Discord to dashboard.
Targeted incrementality testing then validates what the model reveals, while last-touch attribution keeps its job optimizing tactics inside channels. The arc-level verdict belongs to the model.
After-Credits Scene
On Sunday, July 26, the hall closes. The Gandalf staff is disassembled for the flight home, demoted from artifact to carry-on problem. The floor empties in hours.
The Discord server doesn’t disband. The spreadsheet keeper posts a retrospective; the haul photos land; the sentiment, reviews, wishlists for 2027 accumulate in the exact channels where it all started. Propagation is in session and runs far longer than the con itself. Somewhere, a dashboard totals badge scans and calls it a wrap—while the cohort it’s not accounting for is already assembling toward the next thing.
Formation started about an hour ago. The only question is whether your stack notices. Keep your seat.
Build your architecture before the badges drop.
What’s required for Comic-Con marketing measurement exists today. Kochava measurement resolves the identifiers fans hand over into a single journey; SmartLinks™-powered QR codes make booth moments attributable by construction; and AIM by Kochava provides always-on marketing mix modeling. If your brand is activating at Comic-Con, D23, NYCC, or anywhere on the fandom calendar in the back half of 2026 and beyond, this architecture needs to be stood up before the badges drop. Connect with our team to get it in place while formation is still underway.
Comic-Con Marketing Measurement FAQ
How do you measure ROI from a Comic-Con brand activation?
Traditional metrics such as badge scans and foot traffic capture only people who physically enter the venue with a credential, missing the much larger population engaging via offsite activations, pre-event community platforms, and post-event social content. Fandom Cohort Attribution solves this by treating the self-assembled fan community—not a single touchpoint or device— as the unit of analysis, tracing a three-phase arc: formation (Discord, Reddit, creator channels), activation (the event itself), and propagation (post-event UGC). This lets a brand connect community behavior that starts weeks before the con to purchase and engagement outcomes that continue weeks after it ends.
Why is traditional event geofencing an unreliable way to measure Comic-Con activations?
Geofencing captures anonymous device IDs crossing a polygon around the venue, but Qujam’s 2026 guidance shows capture rates ranging from just 5–70%, degraded further by multistory concrete structures and reliance on Location Services being enabled. The data decays within 30 days and carries no identity or relationship context, so it can log that a device entered a building but can’t tell that the person spent 6 weeks solving Easter eggs to get there.
How does marketing mix modeling (MMM) fit into measuring a fandom event like Comic-Con?
MMM is well-suited to Comic-Con because organic fan demand predates any media spend, con week fires multiple channels simultaneously (OOH, booths, creators, earned social), and the Fandom Cohort itself is an aggregate unit that matches what MMM reads from market-level data. It answers the incrementality question of what an activation actually changed, without relying on individual-level tracking.
What is fandom lifetime value and how is it measured?
Fandom lifetime value, a concept floated in Deloitte’s 2026 Digital Media Trends report, treats fan relationships as an always-on, compounding economic asset rather than a single event’s return. It’s measured through identity resolution across identifiers fans hand over voluntarily—email drop registrations, app logins, loyalty IDs—that connect one fan’s journey across multiple conventions and years. In practice, this means matching a fan’s Comic-Con registration this July to their NYCC purchase in October and merchandise subscription renewal next spring, tracking cumulative spend and engagement across all as a single compounding relationship rather than unrelated transactions.