
Our industry is increasingly wary of fraudulent traffic, but the use of fraud abatement tools is beginning to pay off. The Association of National Advertisers (ANA) recently released their latest findings on fraud, which actually showed a decline. Currently, they estimate that losses can reach $6.5 billion this year, down 10% from the $7.2 billion estimated for 2016. The results show an industry taking a stand against fraud yet the reality is that it is ever present.
“Despite the proliferation of fraud detection mechanisms, bots continue to become more sophisticated and evasive,” said Michael Tiffany, CEO at White Ops, who performed the study on behalf of the ANA. He goes on to say, “as these declines are relatively modest, it’s critical that those affected by this threat remain vigilant.”
When reviewing Kochava fraud reports, networks/sites with high click volumes are a surefire bet for fraud. Fighting click fraud requires close analysis of networks/sites because, at first glance, the clicks may appear legit. In my previous blog post, I asked the question, “How many clicks are reasonable from a source of traffic?” We looked at site IDs with remarkably high click volumes and described what the fraudulent tactic might be behind them. In this post, we’ll again look at unreasonably high click volumes but at the device level.
The following table details the top four Android device IDs by click count for an entertainment app during January. This marketer ran a campaign on over 10 networks during that month, and while most Android device IDs (ADID) had fewer than five clicks per install, some were remarkably higher:
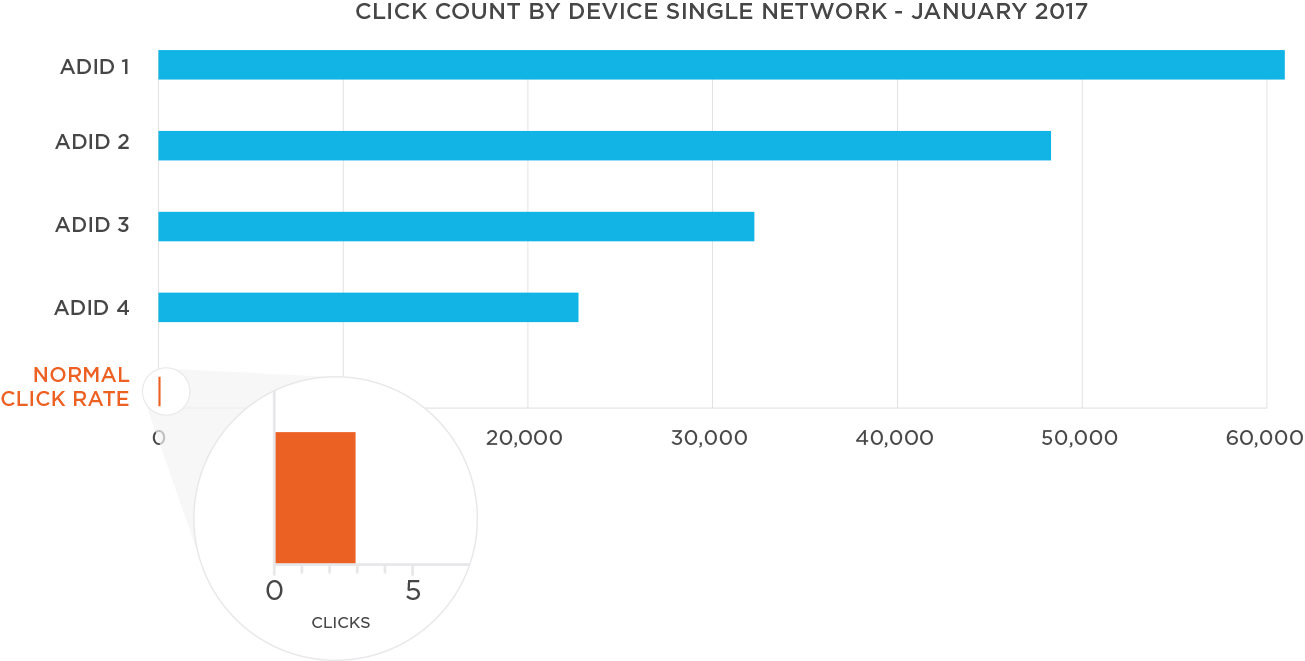
- ADID 1: 61,221 clicks were reported during the timeframe. When we look at the network and sub-publisher breakdown, we see it all coming from one network and a single site ID.
- ADID 2: 48,327 clicks from the same network but two separate site IDs.
- ADID 3: 33,611 clicks from two separate networks but two separate site IDs.
- ADID 4: 23,037 clicks from two different networks than ADIDs 1 through 3 and two site IDs.
From this interpretation, we can make a couple of assumptions: Each ADID had unreasonably high click volume for the period, and the clicks were not user-driven. We often see this across multiple days for the same device.
What’s going on here? Where’s the fraudulent traffic?
For the devices listed above, we suspected the clicks were either generated from automated bots or hijacked devices. The bot was likely an emulator running on a remote service. If it was a physical device, it likely had behind-the-scenes malware installed that spawned clicks without the owner’s knowledge.
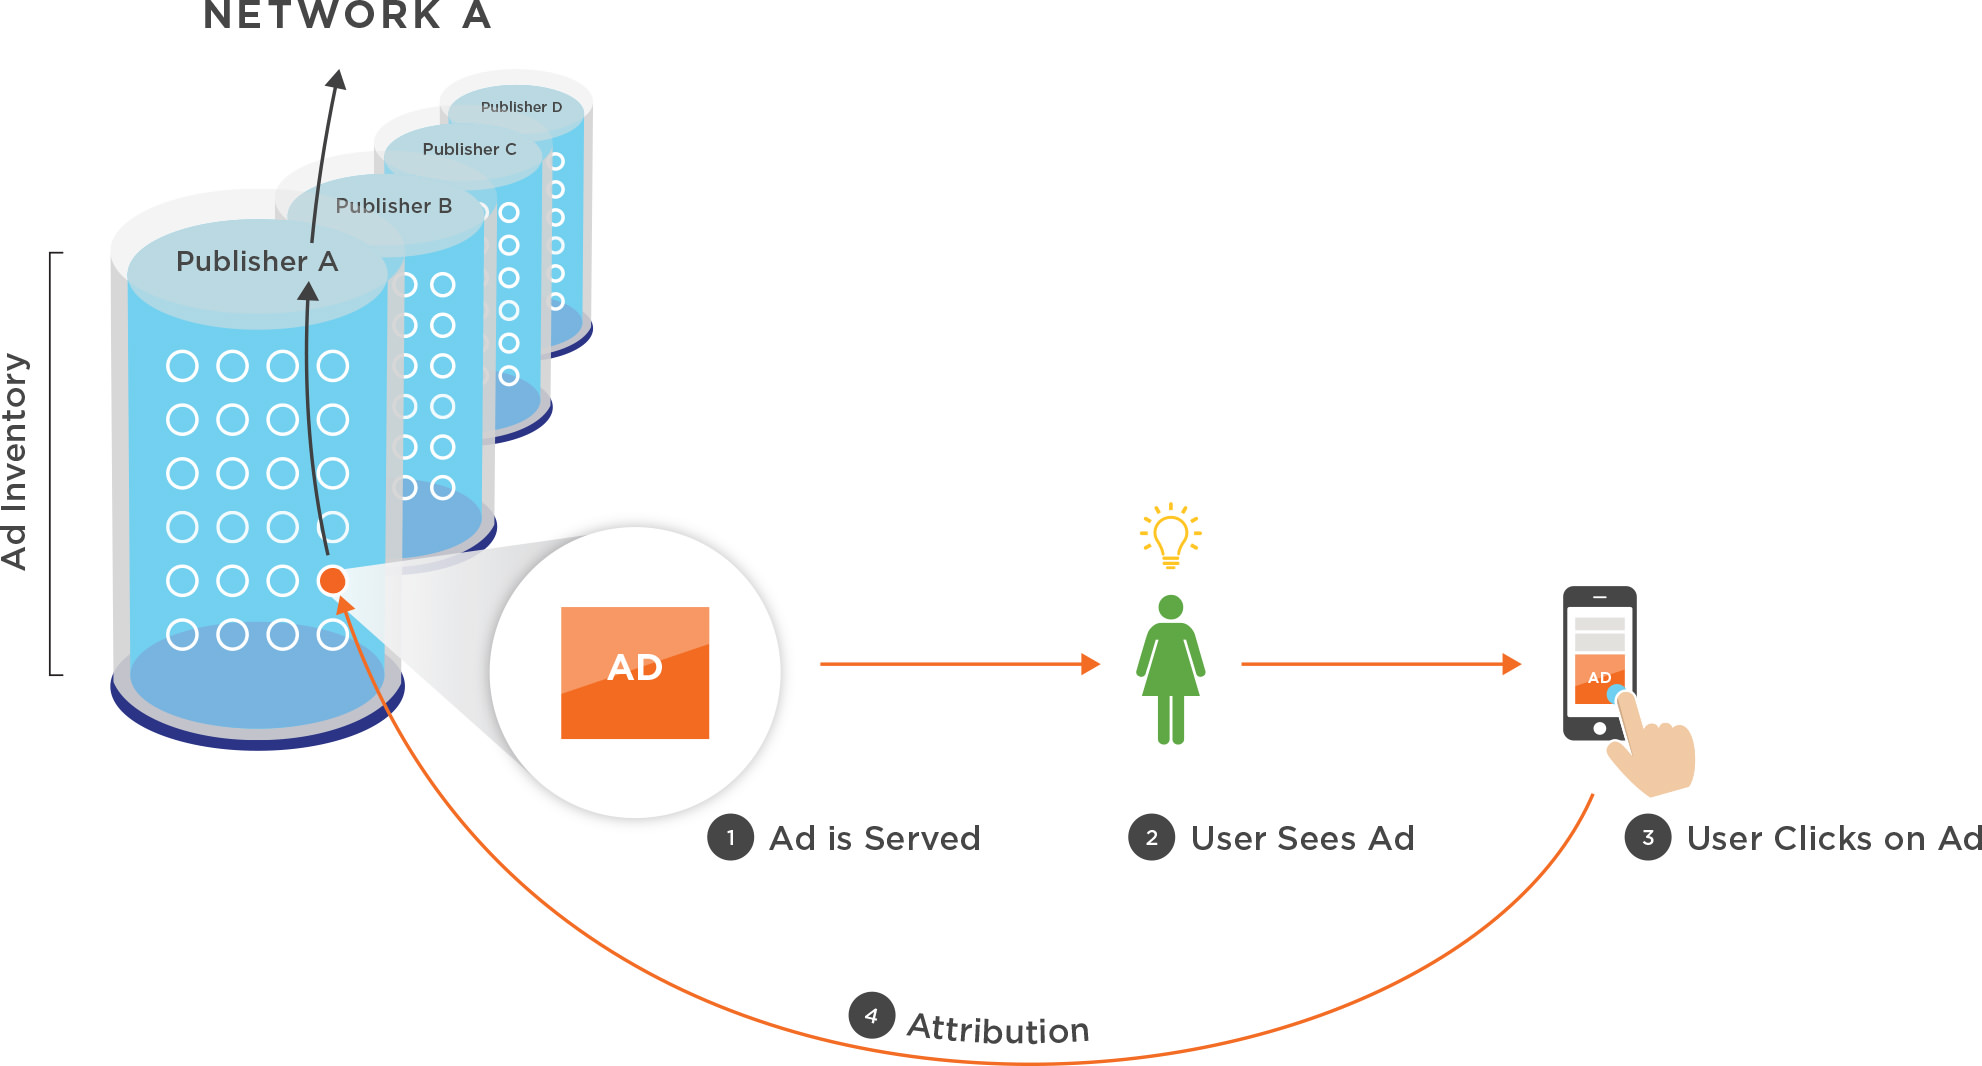
Normal Attribution
Fraudulent Attribution
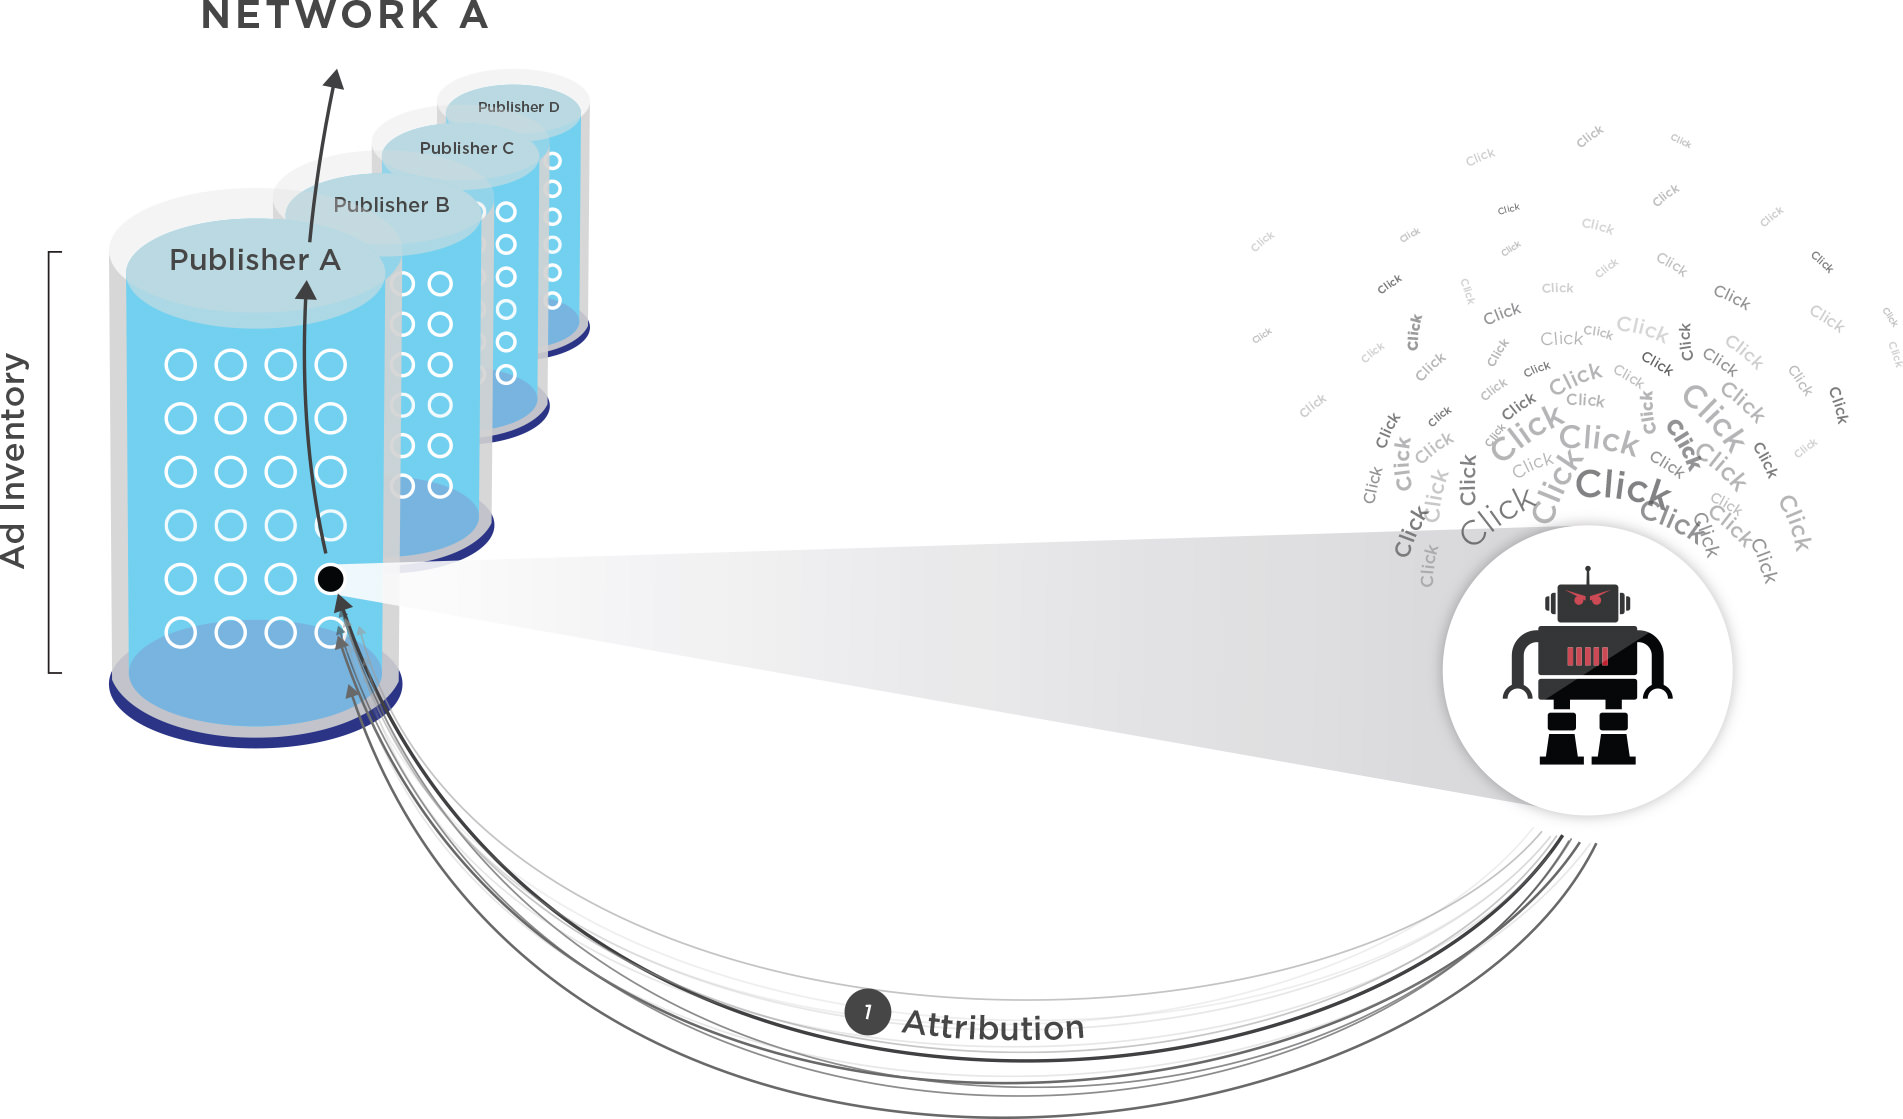
Note that in the fraudulent scenario no actual ad or human are present. Instead, a hijacked device is programmatically spawning clicks back to an endpoint. This is probably not fraudulent activity focused on the marketer but rather the network itself (and likely not intentionally). Each of these devices can only install an app once, so if the marketer is paying some form of CPI (cost per install) pricing, a device bombarding clicks in hopes of driving installs has no monetary upside.
However, networks constantly seek new sources of traffic and are always on the hunt for new sub-publishers. The monetary arrangement between the network and sub-pub is likely different than between the network and marketer. And, the sub-pub may be selling traffic at a low CPM (cost per mille impressions), whereas the marketer is buying on a CPI model. The network pockets the difference.
We see the network’s challenge. As a marketer’s appetite for new installs grows, so must the network’s ability to satisfy it. Networks are constantly on the hunt for new traffic sources, and perhaps a sub-publisher promises lots of volume at a reasonable price—the network has to try it. However, malicious activity is generating the traffic.
In the example above, it’s possible the same bad actor is involved across all the networks and sites. We oftentimes see multiple networks and sites at the device level (like ADIDs 3 and 4), where multiple bad actors may be spread out over several networks. However, it could also be the same bad actor making the same traffic promises to multiple networks.
What can we do about click fraud?
Luckily, this tactic is easy to catch as the outliers are easy to spot. When we see tens of thousands of clicks at the device level, the remedy is obvious. Block that device, and let the marketer know. The less extreme examples are tougher to flag. Again, how many clicks per device is reasonable when it comes to advertising? 10? 100?
To deter click fraud, we allow marketers to cap the number of clicks at the device level. Where they set the cap depends on the app and campaign. There’s no magic number. However, marketers can determine a plausible baseline for their app and campaign because different user audiences will have different numbers of normal click volumes. And, in reference back to that BI article, be careful with cheap inventory as the risk for fraudulent traffic increases. Fraudsters may change bots and devices but they can’t hide their tactics. Detect mobile click fraud through high click volumes.
In case you missed them, read also Parts 1, 3, 4 and 5 of the Fraud Abatement Series.
About the Author
Grant Simmons is the Director of Client Analytics at Kochava and leads the team in analyzing campaign performance and business value assessments. He is the former head of Retail Analytics at Oracle Data Cloud where he worked with over 1,500 retail directors, VPs, CMOs and agencies to develop individualized test-and-learn strategies.
For more information about the Kochava Fraud Console, Contact Us.