
Many, if not most, marketers run campaigns based on install rates. It’s proof that a user was obtained and that marketing efforts were successful. However, Kochava sees all user traffic, and the number of clicks per attributed install doesn’t always add up. While the reasons may differ—be it an error or bad actors—it’s unwanted traffic nonetheless. Detecting fraud by counting clicks and looking at click-to-install rates is one part of Kochava mobile ad fraud detection tools among connected devices.
Our algorithms frequently flag an inordinate number of clicks per install, which increase your ad spend and skew a campaign’s true outcome. Over the next several weeks, we will explore several scenarios, and show marketers and networks how to interpret our fraud reports.
The following table details the click-to-install (CTI) rate across multiple networks for an entertainment app during the month of January:
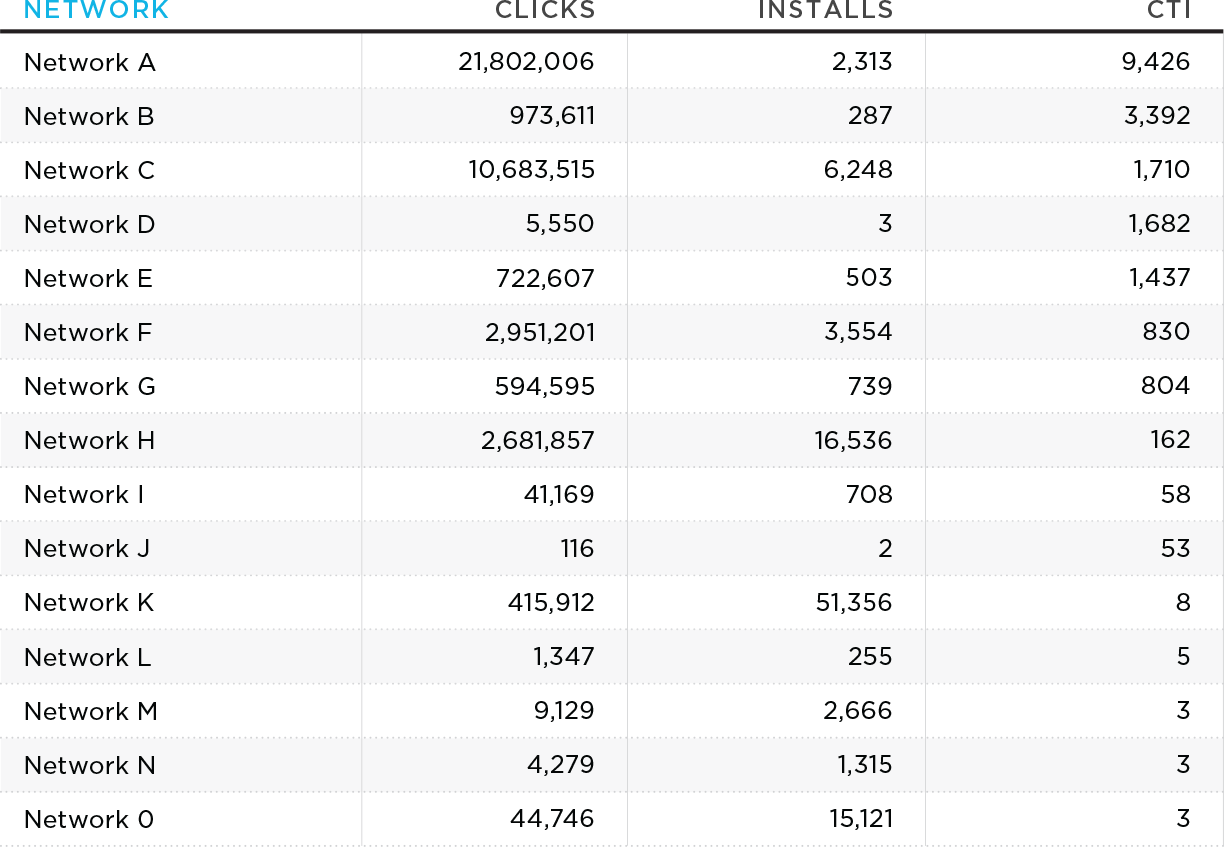
I use CTI instead of conversion rate (CVR) because it’s easier to see the difference between 1,000 and 10,000 clicks than between 0.001 and 0.0001. What’s a reasonable response rate for a network’s traffic? In other words, how many clicks are reasonable for an install?
When we think of a campaign, we envision a creative ad unit with a call to action that hooks the viewer’s interest. Ideally, the user clicks an ad unit, visits the App Store, and installs the target app. If this was the reality across the advertising space, we’d see CTIs with ranges between 1 and 10—not in the thousands.
When an install occurs, the average CTI rate is close to 2.5. This varies by vertical: Social apps are a bit higher, gaming apps are lower. But the average across all apps doesn’t have a huge range; it is closer to two to three clicks per install. This likely fits with your own experience. Think of the last app you installed. Perhaps you clicked on an ad, visited the App Store, left and saw another ad later which compelled you to finally install (for a total of two ad clicks). You didn’t click 9,000 ads before installing.
High click volumes: What’s going on here?
Why are we seeing such high click volumes relative to installs? Are these user-driven clicks, or something else? Are they forced redirects? We’ve all likely been on our phones or tablets when we’re suddenly in the App Store with no reasonable explanation as to how we got there—it just happened.
Are these self-clicking ads or recorded impressions?
The first reason for high click volumes could be self-clicking ads. Envision a video app that programmatically sends click activity in the background of the video, unbeknownst to the viewer. The second could be that the clicks being recorded are actually impressions. The latter may be the scariest scenario because it effectively takes the lowest intent of an advertising function (an impression that may engage the user) and calls it the highest intent ad function (a click, where the user engaged with it).
Click flooding
This last scenario becomes particularly problematic when it comes to web inventory because web ad units generally do not pass a device ID to match with an install, so a probabilistic match (see iOS 14+ restrictions) is used instead. The match is a combination of IP address and User Agent (device type, OS, version, etc.). If the ecosystem is flooded with spurious clicks, and the attribution window is long, we can see a scenario where one user’s “click” can be credited to another user’s install.
For instance, let’s say the attribution window is seven days. Over the course of a week, how many different IPs do we connect with? There are different IPs for home, work, commuting, the gym, restaurants, etc. Regarding the user agent, there aren’t many distinct UA combinations. An iPhone 6 with the latest OS update makes up a large population of mobile users. When one user with a relatively common profile connects to an IP address, where many other iPhone 6’s are connected, we start to see the attribution fallacy that encourages click flooding activity across the digital ad space. If I click on an ad on my device, someone else may install it and the network gets credited with my install—even though none of it was causal. I never actually “clicked” an ad, and the actual user who installed is not tied to a paid marketing effort.
Here’s the point: If a network can get enough clicks flooding the ecosystem, they will pick up installs they didn’t drive.
What’s the big deal about attribution? Those installs happened—what’s there to cry about?
THE WRONG PARTY IS BEING CREDITED!
The game really becomes who can blanket the ad space with the most reported clicks. Forget about viewability. In many cases, the user doesn’t know there was an ad but took some action that generated a click in the background. And by blanketing the ad space with non-user-driven clicks, networks and sub-publishers are getting credit for installs that would happen anyway or are being driven by another source.
What should I do about attribution fraud?
If you’re a marketer, establish a baseline mean clicks to install (MCTI) so you know what to expect from your campaigns. Once you have a ballpark figure, leverage the Kochava Fraud Console which contains a comprehensive global fraud blocklist for you to run with Traffic Verifier. From then on, all device IDs, IP addresses and network/site IDs on the blocklist will be excluded in real time.
Also in Traffic Verifier, set frequency/volume caps for impressions and clicks. Any activity beyond the threshold is considered unverified traffic for you to decide whether to attribute or not.
Couple frequency caps with Alerting to know when a threshold is surpassed. Marketers can set up Alerts for a number of metrics and receive notification (email, SMS, Slack, voicemail) when a cap is reached in real time.
Bad actors have many tactics, but Kochava tools keep marketers in control of their traffic.
Next in our fraud abatement series, I’ll discuss devices with high click volumes and explain the reasons behind this fraudulent tactic.
In case you missed them, read also Parts 2, 3, 4 and 5 of the Fraud Abatement Series.
About the Author
Grant Simmons is the Director of Client Analytics at Kochava and leads the team in analyzing campaign performance and business value assessments. He is the former head of Retail Analytics at Oracle Data Cloud where he worked with over 1,500 retail directors, VPs, CMOs and agencies to develop individualized test-and-learn strategies.
For more information about the Kochava Fraud Console, Contact Us.