Kochava brings advertisers the best tools and intel. The following post from Aarki details the impact of creative optimization on campaign ROI.
Aarki is a Kochava-certified network. Click here to learn how to create an install campaign or reengagement campaign within Kochava.
Every mobile app is unique. It is designed to satisfy its user’s needs in a way that is better than all other apps. And yet, some apps boast of a healthy ecosystem of hundreds of millions of users while others can barely get off the ground. What makes one app achieve user glory while another app falters?
At Aarki, our data scientists and strategists routinely grapple with questions like these. Across the thousands of programmatic app marketing campaigns that we run every quarter, we observe a wide range of performance metrics. We run campaigns covering every app vertical, every geography, and for apps in various stages of the adoption lifecycle. This article explores the potential range of ROI improvements that can be achieved using unified optimization. In subsequent articles, we will focus on specific app verticals and identify the differences in campaign strategies for different app verticals.
Sample Data
The data for this analysis is a random sample consisting of 1,402 distinct campaigns that were run by Aarki between April 1, 2015 and February 29, 2016. To protect the identities of our clients, we don’t share any campaign-specific data in this article. These campaigns represent a diverse mix consisting of both game and nongame mobile apps, campaigns of different budget sizes, and wide geographical distribution. In that sense, they are representative of Aarki’s client base.
Analysis Methodology
Since the optimization objective varied from one campaign to another, the first step was to define a common return on investment (ROI) metric that could be used to analyze performance across campaigns. This common metric, called “Normalized ROI”, is a proxy variable that is directly proportional to the campaign objective (e.g., app installs, bookings, or registrations) and inversely proportional to cost.
We then applied kernel density estimation (KDE) to estimate the probability density function of Normalized ROI. This estimation assumed that the finite data sample represents an underlying population distribution with infinite sampling. The bandwidth of the kernel, a free parameter, was estimated using the expected L2 risk function as given by the mean integrated squared error. The density function was then used to construct a cumulative density function.
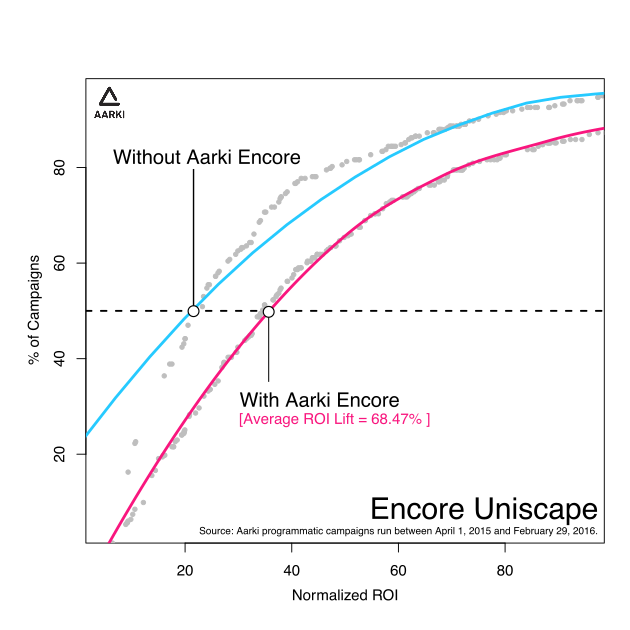
Each gray dot in Figure 1 represents a performance data point for a unique campaign. The set of data points on the left represents the baseline normalized ROI for each campaign, while the set on the right represents the normalized ROI at peak campaign creative optimization. To better understand the lift from the baseline value to the peak value, we fitted trend lines for these two data sets using Loess smoothing. These trend lines are shown in blue and pink for baseline and peak performance respectively.
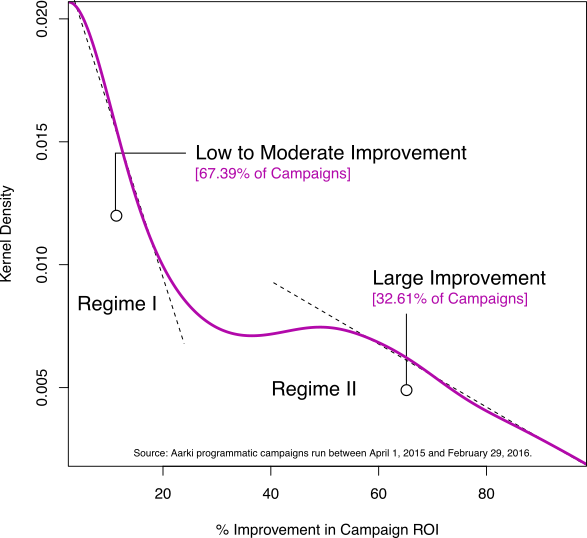
In addition to evaluating the performance lift resulting from creative optimization, the study also focused on understanding the distribution of this lift. Hence, we constructed a difference function of the normalized ROI for each campaign. This difference function, after applying the KDE algorithm, is shown in Figure 2.
Data was initially manipulated in PostgreSQL and then analyzed in R.
ROI Lift With Creative Optimization
Comparing the blue and pink trend lines in Figure 1, we can see that creative optimization leads to a significant lift in ROI. The two lines are quite separated across the whole range of ROI values, indicating that the lift is independent of the campaign and is mostly uniform across all campaigns.
However, there is a bit of convergence for very low values of ROI – not captured by the Loess curve. This indicates that if the initial ROI is very low, there might be something fundamentally flawed with the app or campaign and creative optimization does not have much impact on improving the campaign performance. There is also a somewhat large series separation in mid-range, indicating that there might be a sweet spot for creative optimization.
The average overall ROI lift across all campaigns was 68.47%. This validates the importance of creative and unified optimization in running a programmatic app marketing campaign. In most cases, the Aarki campaign teams are able to achieve this lift in just 1-2 weeks and using small media budgets – making creative optimization an easy and effective way of optimizing campaign performance.
Figure 1: Distribution of ROI performance with and without creative optimization
Distribution of ROI Lift Across Campaigns
The kernel density analysis of the difference function of ROI improvement provides some further interesting insights.
The first striking thing we notice in Figure 2 is that there are two distinct regimes in the kernel distributions – even at the statistical level. Regime I represents over two-thirds of the campaigns that showed a low to moderate improvement in campaign performance. The campaigns in Regime II, while fewer in number, showed a large ROI lift in excess of 40%. This suggests that clearly not all campaigns are the same, with some campaigns being inherently more prone to performance improvement than others. A further analysis of the correlation of ROI lift with campaign characteristics should be an interesting study.
Figure 2: Kernel density of the difference function of ROI improvement
Summary
In this article, we have presented the results of a kernel density analysis of the ROI improvements realized by applying Aarki’s unified optimization algorithms to a diverse selection of campaigns. The results indicate that the performance improvement is robust and consistent, but the size of the improvement can vary.
Aarki is a Kochava-certified network. Click here to learn how to create an install campaign or reengagement campaign within Kochava.