Expert insights from webinar with Samba TV and Next in Media
TL;DR Summary
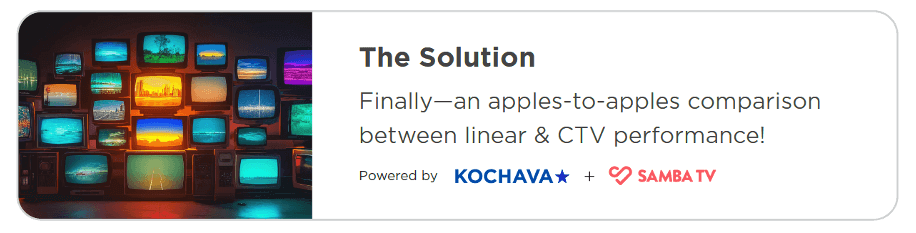
Television advertising faces a persistent measurement challenge: Viewing is fragmented across myriad streaming and linear platforms, with attribution trapped in silos, making it difficult to connect TV impressions to business outcomes. The Kochava-Samba TV partnership solves this by providing unified TV measurement across smart TVs, applying identical methodology to all linear and CTV exposures, and connecting them to verified conversions (app installs, sales, store visits). Crucially, while last-touch attribution often credits other channels, the data shows CTV driving 95% of search behavior in dual-exposed users. For the first time, marketers can identify which networks, dayparts, and creative variants actually drive outcomes and optimize midflight based on apples-to-apples performance data. Marketers seeking unified insights across linear and CTV spend can request a free consultation.
The campaign launches at 8 PM Eastern on a Tuesday in October. A national QSR’s Family Feast spot goes live simultaneously across ABC’s primetime lineup, cable networks, and eight streaming platforms. The CTA is clear: Download the app, order tonight, get 20% off.
Soon thereafter, the marketing director drowns in 11 separate performance reports. Nielsen claims one reach number. Hulu reports another. Netflix doesn’t share theirs. The mobile attribution platform shows 47,000 app installs, but which portion of the TV budget drove them?
This is the ongoing challenge marketers face: As TV viewing fragments across platforms, measurement tools haven’t kept pace. More data than ever. Less clarity about what actually drives outcomes.
Until now.
Solving TV’s Translation Puzzle
On July 29, 2025, Samba TV and Kochava announced a partnership designed to provide consistent measurement across TV and digital platforms—addressing one of the marketing industry’s biggest unresolved issues around cross-channel television attribution and measurement. The collaboration marries Samba TV’s first-party viewership data across 50 million smart TVs with Kochava’s attribution spanning mobile, CTV, web, and physical retail.
Kochava Founder and CEO Charles Manning described the partnership as a way to “bring verified outcomes to linear TV at scale”—aiming to move beyond basic data integration toward a unified view of the consumer journey.
For the first time, marketers can compare results across linear TV, CTV, and digital channels using shared metrics—clarifying which networks, time slots, and creative variants actually drive installs, orders, or visits. Not reach. Not frequency. Outcomes.
Unpacking the Unified TV Measurement Solution
To explore the partnership’s implications, Kochava hosted Beyond Fragmented Signals: Unifying Linear TV + CTV for Cross-Platform ROI, a webinar featuring a powerhouse panel of industry luminaries: Michael Shields, founder of Next in Media, a veteran analyst covering advertising and media; Aden Zaman, Chief Commercial Officer at Samba TV, an expert in media intelligence and first-party viewership data; and Grant Simmons, VP of Kochava Foundry, specialist in cross-channel measurement and attribution.
Their discussion illuminated TV’s measurement challenge and the elegant, standardized approach emerging to solve it.
What’s Changing in TV Attribution?
- Streaming and connected TV (CTV) now dominate overall TV viewing time, outpacing traditional linear television.
- Brands face growing challenges in measuring audience reach and connecting ad exposures to real outcomes as viewers fragment across platforms.
- Old metrics such as reach and frequency are no longer enough; attribution is shifting to unified, cross-platform measurement of actual business results.
- The latest solutions enable marketers to compare performance across linear TV, CTV, and digital channels directly—using the same methodology for the first time.
The Fractured Landscape
The numbers reveal a transformation that has outpaced measurement infrastructure. Streaming now captures 60% of total TV viewing time; linear holds the other 40%. Two years ago, these numbers wore opposite jerseys. CTV viewing hours have surged 46% year-over-year. Meanwhile, linear viewing hours are up 1%.
For even more insights, download Samba’s 2025 U.S. State of Streaming Report.
“There was a time when you could buy prime-time ads and probably reach 80% of the country,” Zaman observes. “Now you buy them, you might reach 20% if you’re lucky.” Consider this: 94% of TV ads now reach fewer than 50% of households. The mass in mass media has quietly evaporated.
Advertising dollars tell a different story—cautious reallocation rather than wholesale flight. Linear still commands majority TV ad spend, though CTV projects to overtake it by 2027. The inflection point approaches but hasn’t quite arrived.
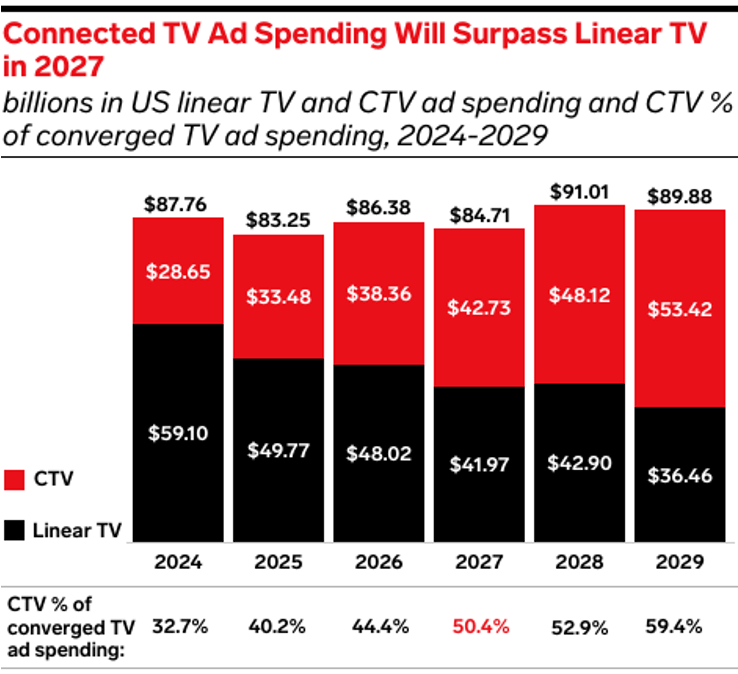
EMARKETER forecast, March 2025
Ad-supported tiers are markedly accelerating the shift. Among new OTT subscriptions, 56% choose ad-supported plans, according to Samba TV. Inventory floods the market as audiences fragment across an expanding universe of platforms.
Over half of SVOD subscribers across top platforms now use ad-supported plans—with Prime Video leading at 78%, followed by Hulu and Peacock at 62% each.
ARF DASH TV Universe Study, Spring 2025
Television’s central paradox: more advertising opportunities than ever, diminished ability to measure them coherently.
Measurement Blind Spots
Shields captures the industry’s uncomfortable irony: “For the longest time, there was complaining about Nielsen having a monopoly. Meanwhile, they complained about the walled gardens in digital advertising. Now you’ve got all this fragmentation, every media company playing the walled garden thing—their own identifiers, graphs, way of measuring. Now everything’s a walled garden, and at least Nielsen was simple.”
Linear TV measurement offers broad averages with limited segmentation—useful for understanding markets, inadequate for optimization. CTV provides granular data trapped in publisher-specific silos, each with proprietary methodology. Netflix measures one way, Hulu another, YouTube TV yet another.
“Up to 40% of a brand’s ad buy might still be on linear,” Simmons explains. “But how does this 40% compare to their 60% CTV? Historically, they haven’t had the ability to make that comparison.”
The gap extends beyond media metrics to business outcomes. Marketers need to connect TV advertising—regardless of delivery mechanism—to app installations, ecommerce transactions, subscription activations, store visits. Without these connections, TV advertising remains trapped defending reach and frequency while digital channels capture performance budgets through superior attribution.
Architecting a Solution
The technical foundation: straightforward. The implications: profound.
Samba TV measures second-by-second viewership on 50 million opted-in smart TVs, tracking activity across more than 2,000 networks and 300 streaming apps. This data feeds into an identity graph that links ad exposure to households and devices.
Kochava provides outcomes infrastructure, tracking conversions across mobile apps, CTV apps, websites, ecommerce platforms, and physical retail. Software development kit (SDK) implementations span thousands of apps. Integrations include Shopify (DTC), Polk (automotive), footfall analytics (retail visits), and Fandango (theatrical outcomes).

Match Samba TV’s household-level ad exposure data with Kochava’s device-level conversion data, and measurement threads emerge, connecting TV impressions to business outcomes no matter where the impressions originate.
“It comes down to match rates, the Venn diagram of footprint between our two universes,” Simmons notes. “Our match rate with Samba TV is very high, which allows us to have veracity in the measurement.”
The measurement process uses synthetic control groups and machine learning to adjust for outside influences—allowing conversion rates from NBC, Hulu, or any platform to be evaluated on equal footing.
Apples to apples at long last!
”For the first time, you’re able to get pure comparability between linear and connected TV and other digital platforms.
Aden ZamanChief Commercial Officer, Samba TV
Attribution Sleight of Hand
One of the webinar’s most compelling insights centered on how last-touch attribution systematically undervalues television’s role in driving conversions.
Simmons illustrates: “If you’re on an iPhone and you search Netflix, 9 times out of 10 you’ll click the first result. Netflix probably paid upward of $10 for that tap. But the reality is that lots of mid-funnel and upper-funnel things drove you to that search behavior.”
The data exposes the trick. In one analysis spanning 20 million installs, 500,000 users saw both CTV ads and search results. Of these dual-exposed users, CTV came first 95% of the time. For social media, CTV preceded social touchpoints 94% of the time.
Television drives search and social as outcomes. But who captures credit in the dashboard? The last touch.
This undervaluation creates perverse incentives—budget shifts toward channels capturing credit rather than those creating value. Unified measurement corrects this by revealing each touchpoint’s actual contribution.
“Linear tends to be more performative than folks give it credit for,” Simmons observes. “If you’re buying 60% CTV and 40% linear, you might want to pick up a little more value from linear.”
The secret: What looked like search performance was television’s work all along.
”Linear tends to be more performative than folks give it credit for.
Grant SimmonsVP, Kochava Foundry
What the Numbers Reveal: A Case Study
A quick-service restaurant (QSR) case study highlights the unified TV measurement strategy. The brand allocated 80% of its budget to linear TV and 20% to CTV, tracking which platforms actually led to mobile app downloads. Unified measurement revealed what siloed data could not:
Geography: Southern California DMAs overindexed for store visits. Chicago underperformed. Regional reallocation followed.
Networks: Nickelodeon and ABC outperformed for in-app order completions—a not-so-obvious insight guiding future buys.
Creative and daypart: Primetime Family Meal ads drove 50% higher conversion than alternative messaging.
Frequency: Diminishing returns showed after five exposures, rationalizing budget deployment.
Performance data arrives within 48–72 hours through daily dashboards—enabling midflight optimization impossible with linear’s traditional measurement cycles.
“We delivered believable, defensible results,” Simmons recounts. “The brand could finally see, ‘Of my 40% on linear and 60% on CTV, what’s the actual downstream performance?'”
Performance Meets Brand (Finally)
Unified measurement collapses television’s brand-vs.-performance distinction. Historically, TV has meant mass marketing and vague awareness metrics, not incrementality testing and coefficient lift.
This is changing. CTV’s targeting capabilities and measurable performance attract new advertiser categories—Instagram-native brands previously viewing television as inaccessible.
Shields poses the question “Is the measurement ahead of buying capabilities?” The gap between what can be measured and how quickly budgets shift remains real.
“Do you need a good answer now or a perfect answer later?” Simmons asks. Performance marketers want signal as fast as possible.” Television’s cadence differs from mobile’s sub-hour optimization cycles. The partnership’s 48–72 hour reporting bridges that gap—not mobile-fast, but leaps beyond linear’s traditional weeks-long measurement cycles.
Fast enough to optimize. Precise enough to prove value. This is the new standard.
Advertising Landscape Inflection Point
To conclude, the panel turned to television advertising’s future trajectory. “It’s an existential moment for TV,” Shields observes. “The more sophisticated attribution you can bring, the more confident brands become. But the structural challenge is who controls media budgets. That’s where change happens slowly.”
“TV’s always been the best place to tell a story,” notes Zaman. “TV was one-to-many, but CTV makes it almost one-to-one. TV can still start a story; CTV lets you continue it with sequential messaging.”
The brands mastering this convergence—full-screen video’s emotional impact meeting digital advertising’s targeting precision—will capture television’s next chapter.
Linear TV + CTV Q&A Featuring Grant Simmons
Following the webinar, the Kochava Foundry team compiled questions from attendees alongside additional inquiries that frequently arise when brands explore unified TV measurement. Simmons offers detailed responses addressing technical infrastructure, measurement methodology, implementation considerations, and strategic applications of the Kochava-Samba TV partnership.
Technical Infrastructure & Data Collection
How does Samba TV collect ACR (Automatic Content Recognition) data?
Samba TV collects ACR data by passively monitoring viewership across millions of smart TVs for which users give consent during setup. This process captures second-by-second, household-level exposure to everything viewed on the television, including both linear TV and streaming content from over 300 apps. The data covers more than 2,000 networks across all 210 U.S. DMAs and is also operational in nine countries worldwide.
How do you aggregate signals from streaming/CTV vs. linear TV to track users across both ecosystems?
An advanced identity graph brings together data from across the fragmented TV ecosystem. It combines Samba TV’s linear playlogs and ACR data with digital ad and conversion signals from CTV, mobile, and web. This allows the system to track users across TV sets and devices within a household and segment audiences into distinct groups: linear-only, CTV-only, or both.
Linear TV + CTV Measurement Methodology
How do you measure and optimize incremental reach across linear TV and CTV without double-counting audiences?
We use a unified measurement solution that applies the same methodology to both linear and CTV data. The identity graph helps reveal audience overlap, while deduplication—using “impression windowing”—ensures that rapid-fire exposures are counted accurately, avoiding inflated reach and frequency metrics. By analyzing separate audience cohorts (linear-only, CTV-only, or both), we can pinpoint each segment’s unique performance and true incremental reach.
What methodology do you use for brand lift measurement?
We use synthetic control groups across both linear and CTV environments. After a campaign, we build an unexposed group that’s matched to the exposed group based on factors such as historical activity, device type, and demographics. This approach helps control for seasonality and other media exposure. Machine learning further adjusts the groups to correct for preexisting differences, ensuring that our lift measurement reflects the true impact of the ad campaign.
How can advertisers build attribution models connecting brand campaigns to business outcomes?
Advertisers should use a unified attribution framework that applies the same methodology to both linear and CTV. By using synthetic control groups, we can isolate the impact of media from other factors, making it possible to compare metrics including lift, reach, frequency, and ROI consistently across channels. This approach connects campaign exposure directly to real business results.
Metrics & KPIs
What specific metrics and KPIs are being measured, and which technology partners enable this measurement?
Kochava and Samba TV’s partnership enables full-funnel outcomes reporting, linking TV impressions to business outcomes.
We can measure all of these:
- Business outcomes: sales, app installs, store visits, order success
- Performance metrics: lift, reach, frequency, ROI
- Granular breakdowns by creative variant, frequency, geography (region/DMA), network, daypart, and program or genre
Reporting & Optimization
How quickly can brands access performance data, and how does this reporting speed help optimize campaigns?
Performance data is available within 48 to 72 hours through daily dashboards and analytic summaries. This near real-time reporting allows brands to adapt campaigns midflight—reallocating budgets quickly and maximizing ad spend efficiency, a major improvement over traditional linear measurement cycles.
Business Outcomes & ROI
How are leading brands connecting performance metrics from linear and CTV to demonstrate true business ROI beyond media efficiency metrics?
Leading brands use unified measurement to link every TV impression—across linear and CTV—to business outcomes like sales, app installs, and store visits. Our granular reporting shows which networks, programs, dayparts, and creative variations deliver the strongest results. Brands can then optimize for real business value, not just media efficiency metrics like GRPs.
Budget Allocation & Strategy
How should advertisers balance budget allocation between performance marketing and brand marketing using unified measurement?
Unified measurement covers both brand awareness (lift, reach) and performance (conversions, ROI) using the same approach, allowing direct comparisons. Brands can experiment with different budget splits and see real-time impact—as in the QSR case, where some placements drove direct response and others built awareness. With reporting within just a few days, it’s possible to rebalance spend mid-campaign, often revealing that linear TV performs better for direct response than you might expect.
Competitive Differentiation
How does this approach differ from what Nielsen or other traditional TV measurement providers offer?
Unlike traditional options like Nielsen, we move beyond broad averages or limited segmentation. Our approach delivers granular, full-funnel outcomes reporting, letting you directly compare linear and CTV using a unified methodology. Plus, you get results within a few days, not weeks as with traditional linear measurement.
How does unified TV measurement compete for advertising dollars against social platforms that have first-party logged-in user data?
Unified TV measurement brings advantages like household-level targeting across 50+ million TVs, premium high-attention inventory, and cross-channel attribution tying TV exposure to mobile, web, or in-store actions. Fraud rates are lower than social feeds, and you get digital-like performance metrics for TV—making it possible to allocate spend based on genuine results, not just where measuring happens to be easier.
Privacy & Compliance
What privacy and compliance measures does your solution employ?
Our approach is privacy-first: Devices are grouped into privacy-safe clusters, not tracked individually, so data remains accurate but not personally identifiable. We comply with all relevant regulations (GDPR, CCPA). Samba TV collects ACR data only from smart TVs where users have given consent during setup, and all data is encrypted using industry-standard protocols.
Getting Started & Implementation
What does a typical implementation timeline look like for brands wanting to get started with unified linear and CTV measurement?
For existing Kochava clients, setup usually takes just a few days since it uses existing SDKs.
New clients can expect:
- Initial setup and SDK integration: 1–2 weeks
- Campaign configuration: 3–5 days
- First results: 48–72 hours after campaign launch
Samba TV’s data collection is fully passive and doesn’t require custom integrations, so once configured, reporting is always on and refreshed daily.
The Path Forward
The Kochava-Samba TV partnership delivers methodological consistency across environments that have historically resisted comparison. By applying a single measurement standard across platforms, the partnership skillfully turns TV from a branding blind spot into an accountable performance channel—letting marketers connect TV exposure to real business results.
For brands navigating the linear-to-multi-platform transition, this provides the missing compass—revealing not just where impressions are delivered, but which combinations of channels, formats, dayparts, and creative variants drive outcomes.
The measurement infrastructure now exists. Now it’s all about execution.
Ready to move beyond TV measurement silos? Kochava Foundry can walk your team through unified attribution for linear TV, CTV, and digital channels. Request a free consultation.