
Too many marketers aren’t measuring their return on ad spend effectively. In fact, according to a recent article by MediaPost, analysts found that 67% of marketers admitted to not even knowing how to measure the return on their investment (ROI) in mobile. This is especially disconcerting considering that 69% of consumers are using their phones in stores and 47% are using them for product research.
Yesterday, we talked about how tracking post-install events is the first step to measuring your mobile ROI. Now, let’s dive deeper into colliding rich event metadata with campaign cost to expose the question that everyone should be able to answer when asked, “What is your ROI on this campaign?” Wouldn’t you love to be the superstar on your team who can definitively measure, report and confirm the performance that you work so hard to achieve?
Step 2. Analyze cost data
Once you’re tracking rich event data you can see the true value of your campaigns by overlaying cost data. Those Kochava-certified networks with the ability to pass cost data, encompass over 90% of all traffic. Check out the Media Guide to see which integrations already include cost data.
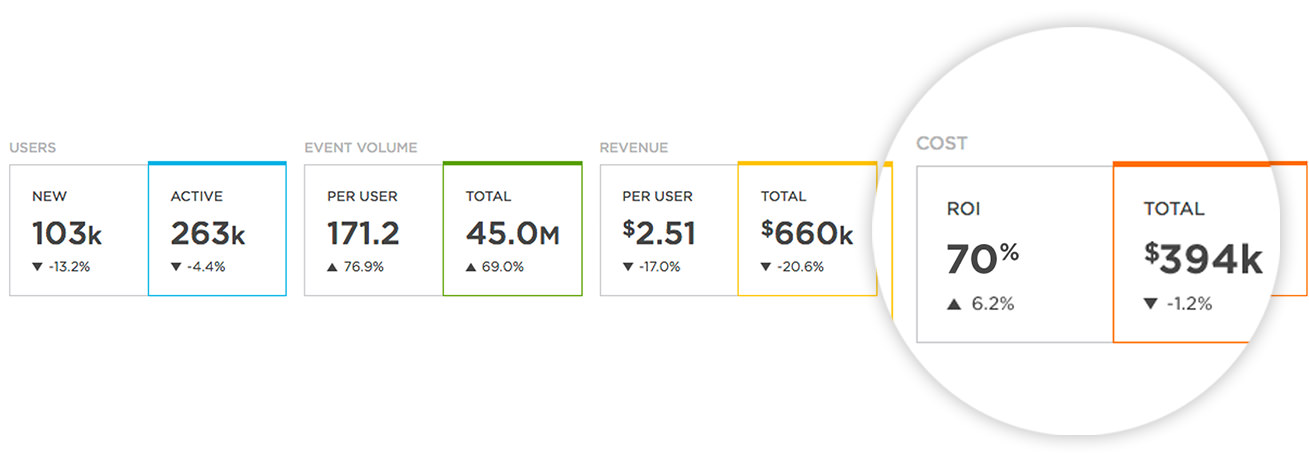
Kochava dynamically aggregates the cost associated with your campaigns and visualizes it within the Analytics dashboard. Here, you can look at your costs alongside installs and events, including revenue-driving events, to get a holistic view of your app performance. You can easily split cost data by media partner, site ID, creative, user LTV, retention or any other tracked element. Without cost data, the only option is to manually compare network reports with your tracked revenue.
Pro Tip: Pass rich content, including monetary value, with every purchase or subscription event for segmentation purposes.
The first and second missing pieces in your app strategy are event tracking and cost analysis. Stay tuned tomorrow for the third of our five-part series – The Missing Pieces of Your App Strategy.