This is the final week of a 5-week series on Configurable Attribution. We looked at Lookback Windows in week #1, Probabilistic in week #2 (see iOS 14+ restrictions), Device Reconciliation in week #3 and View-Through Attribution in week #4. Now that you have a handle on how to leverage configuration, let’s look at the resulting reports and how you can use them to further optimize your configurations.
If you’re doing active user acquisition or monetization, you are already looking at reports on a daily basis. However, there are a few specific metrics you may not be considering including mean time to install (MTTI), mean time to action (MTTA), and Influencer reporting.
MTTI and MTTA are two of the most interesting and under-leveraged metrics in the user acquisition and monetization space. These data points reveal the statistical mean for how long you can expect users to take between click and install/action to reach the desired conversion point. This analysis can be at the app level to give you insight into your audience’s behavior, and at the network level to fine-tune your attribution configuration. Now you can optimize your lookback windows to reach the maximum audience, while avoiding the point of diminishing returns.
A sampling of average MTTI by vertical
For all intents and purposes MTTI and MTTA give the same insight: MTTI for install campaigns and MTTA for reengagement campaigns. In the following examples, we’ll look at MTTI, but the same examples exist for MTTA.
For example, if the MTTI for your app is 30 hours, that tells me that the majority of my users wait approximately between 1 and 2 days to launch the app, after downloading. You can then compare your MTTI for the app to MTTI by network to start tuning your lookback windows. If your MTTI or MTTA for Network A is comparable to your app (~30 hours) then you can set your lookback window to 3 days without missing much traffic. Now you can look at a 3-day cycle on campaigns for quicker optimization.
Conversely, if you see a network with an MTTI much lower than your app, it means that users are launching the app much more quickly on this network, than on average. This may indicate that there is a publisher within the network which is mixing incentivized traffic in with non-incentivized traffic. This also happens to be a simple example of what Kochava Fraud Detection uncovers.
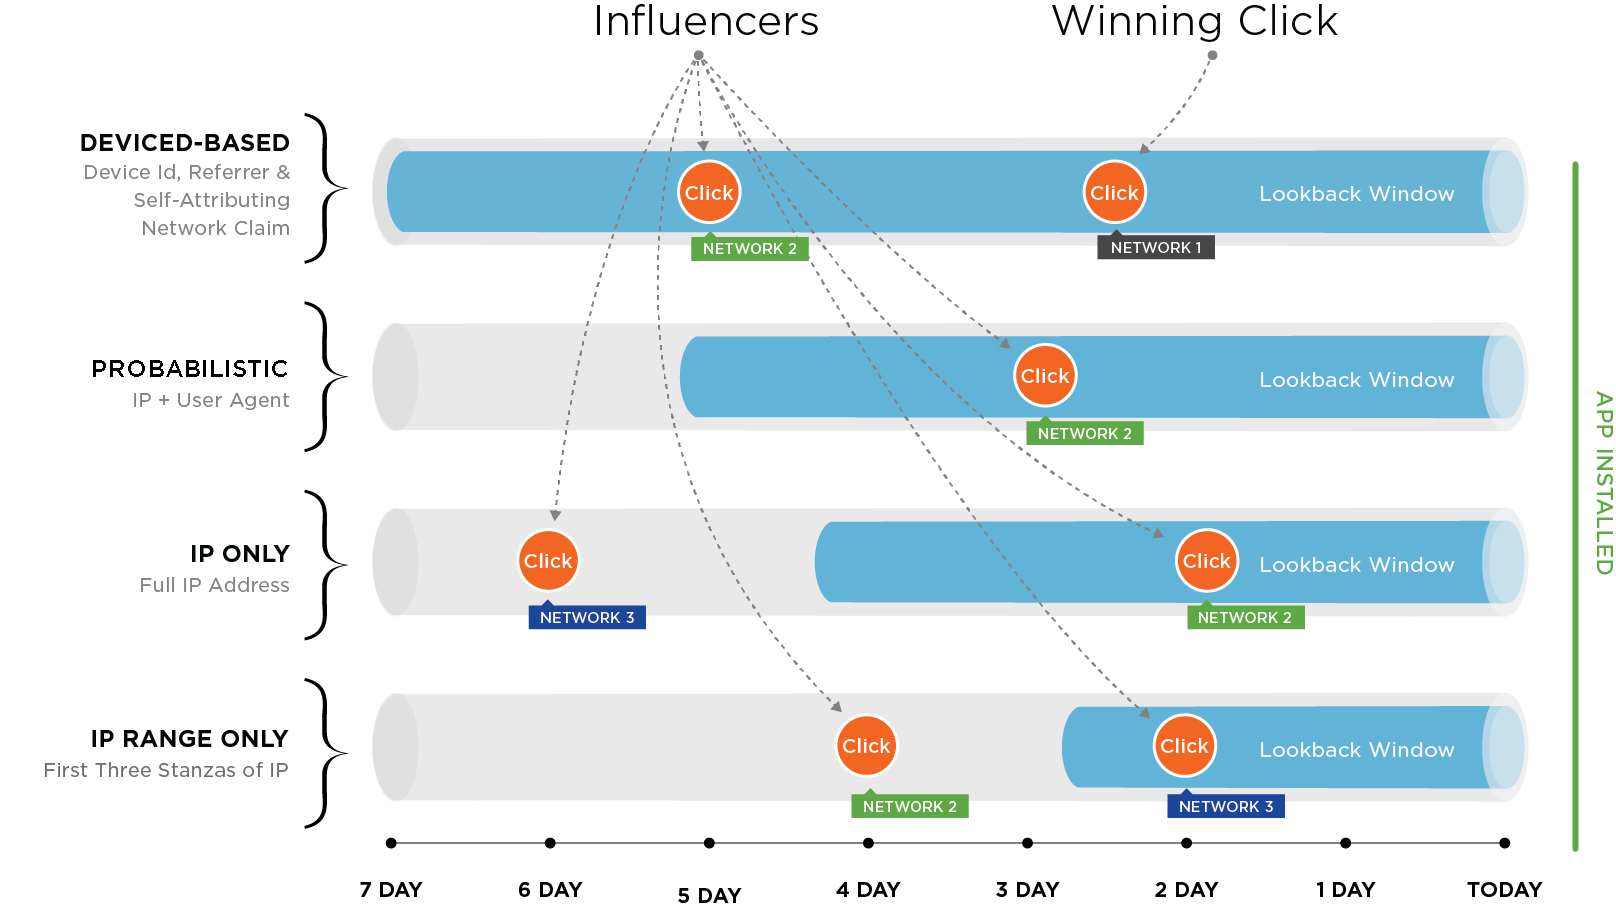
Two other critical pieces of intel to review are the Influencers and Influencer Summary reports. These reports show which networks are driving traffic and clicks, despite not having the winning click. Influencer reporting gives data about the click including the reason it did not win. Reasons may include being outside the lookback window, not being the last click, or being superseded by a higher match-type. You can consume Influencer data at an aggregate level (Influencer Summary) or at the device level (Influencer Report). These reports give you the actionable intelligence needed to manage your budget and ROI based on networks that are driving traffic, independently of whether they are winning attribution for installs.
The image below demonstrates the importance of influencing networks.
For more information on available reports and how to make the most of them, email your account manager or sign up now.