
Posted March 15th, 2017
IMPORTANT: Probabilistic attribution is discussed at length within this post. Please see iOS 14+ restrictions on probabilistic attribution here.
Over the last two posts on fraud, we’ve detailed how the click:install ratio can be used to identify sketchy traffic. In this post, we’ll look at app install metrics, specifically the time difference between the user click and the install event, to illustrate some interesting fraud tactics. Take control of your fraud abatement with Kochava mobile ad fraud detection tools.
Before we begin, however, ask yourself, “How much time is reasonable between clicking an ad and installing an app?” Or more importantly, “How fast is too fast?” To determine what’s reasonable, you need to know your audience’s behavior based on past campaigns. Some app campaigns may have faster click-to-install times than others.
Next, let’s lay some groundwork. There are several touchpoints in the chain of events from impression to launch. The user sees an ad, clicks on it, is redirected to the app store, downloads the app (generally around 45 MB) and launches (installs and opens) the app. This series of actions “wakes up” the Kochava SDK to begin recording post-install events. When we talk about time to install (TTI), we’re talking about the time difference between the click event and the first launch of the app.
We detect fast TTI outliers in a few different ways. The entire site ID (sub-publisher) may be driving traffic much differently than the parent network as a whole. We flag this as a mean-time-to-install (MTTI) outlier. However, the entirety of a site ID’s attributed installs may have a spread from short TTIs to long. In this case, the entire site ID isn’t problematic in terms of MTTI, but it may be flagged as a TTI outlier.
We need to dig a bit deeper to see what’s behind those outliers.
Within the attribution space, marketers and networks struggle to identify appropriate attribution windows because the answer changes from app to app. What remains consistent is the argument that mobile advertising creates interest and action where we expect the distribution of installs to be closer in time to the click event. However, sometimes we see the opposite, and install events increase the further they get from the attributed click. A flat or inverted distribution of installs from the click may indicate fraudulent traffic sources as well.
Let’s walk through a scenario for MTTI, TTI and flat/inverted separately.
Mean-time-to-install (MTTI) outliers
The chart below shows the distribution of site IDs in terms of average MTTI for a month’s worth of click and app install metrics. In total, there were 139 site IDs within a network’s campaign trafficking ads for the month. We also see that generally, they have a normal MTTI distribution around 18 hours.
On the far left-hand side of the graph, there are three site IDs that have an MTTI under 30 minutes. There is something obviously different about those three sites relative to the network traffic as a whole. Within the Fraud Console, we flag site IDs greater than 2.5 standard deviations from the mean as potential sources of unrequested incentivized traffic. Incentivized sources of traffic benefit the user, such that their only interest in the advertised app is to get something for free, elsewhere. For instance, “Install this app and get 30 more gold coins for the game you’re playing,” is an example of incentivized traffic.
This doesn’t mean that all fast installs are fraudulent. If sites are incentivized, a quick check of post-install events will show whether the traffic is incentivized or something else. For example, an app has a registration event that entails the user submitting an email address and verifying via a separate link. If we look at 7 days from the install, the average across all traffic with this registration event is 15%. In this case, traffic from the three questionable site IDs has an average 1% of installs with the registration event. Not only is the click-to-install time much different than the average, so is the quality of the installs. This is clear evidence of incentivized traffic.
Conversely, sites with fast MTTI may look too good to be true in terms of install quality (when looking at post-install event usage). In this case, the site may be injecting clicks in order to win organic installs. We’ve seen this particularly in Android campaigns, where the fraudster is able to identify an imminent install and programmatically injects a “click” to win attribution.
TTI outliers
As I mentioned earlier, the entirety of a traffic source may not be a statistical outlier per se, but we may still detect fraudulent behavior. Let’s look at an example dataset of clicks and installs from a specific network of a finance app (Android) during December of 2016.
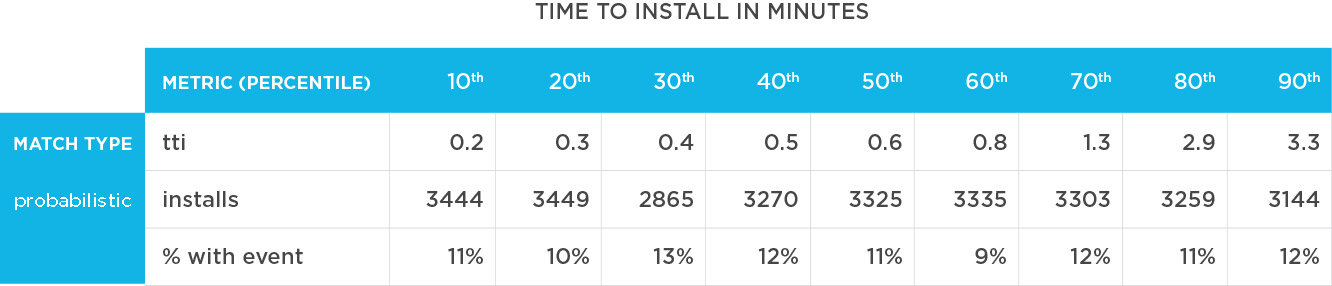
The table below details several different points:

- Installs are evenly stratified into TTI deciles: fastest 10%, next 10%, etc., in average minutes for each grouping of 10%
- Installs are broken out by device or probabilistic** matches (a proxy for in-device inventory vs. web inventory)
- Within each decile, a percentage of those installs with a specific post-install event (in this case, a sign-up event) is used as a way to measure install quality
- Device matches make up 7% of total installs for this network, and the MTTI through the 90th percentile is 315 hours
- For probabilistic** matches (the bulk of installs for this network), the MTTI through the 90th percentile is 7 minutes
- The time disparity indicates that the tactics/traffic from probabilistic** is significantly different than that from device inventory
Within the probabilistic** match table, look at the TTI increase from the 70th to the 90th percentile. In the course of 5,014 installs, the TTI increased 37 times, indicating the tactic/traffic is different even within the probabilistic** inventory.
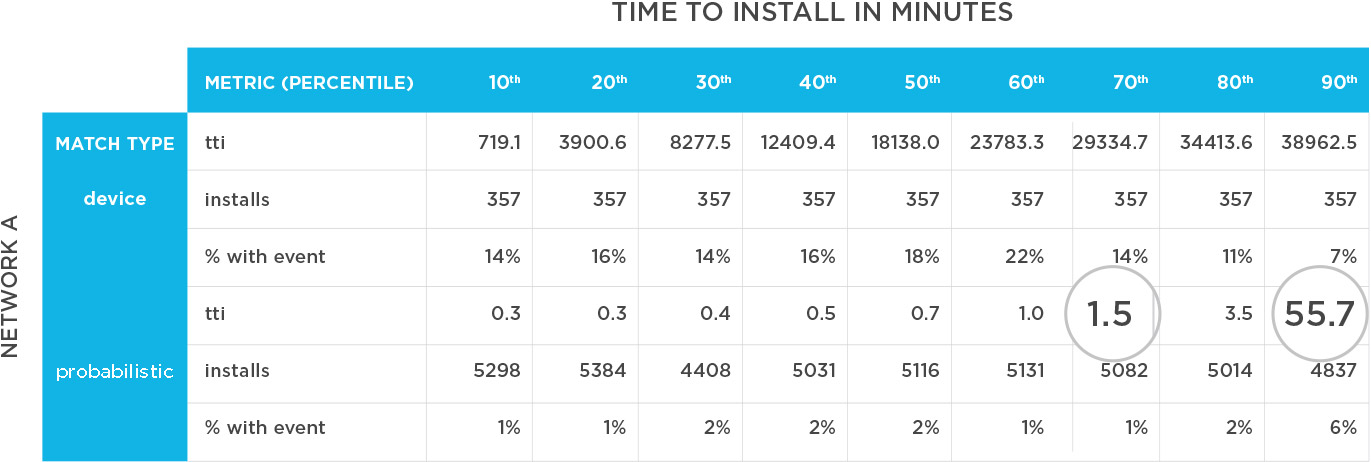
Now let’s look at the fastest 10% of installs on probabilistic-matched** traffic. Again, the user clicks on an ad, is sent to the app store, downloads (in this case a 48 MB app) and launches it, but 5,577 users do so in 15 seconds? Let’s dig in a bit more.
Across all traffic sources, 12% of installs have the sign-up event. Let’s look at quality by TTI decile:
Device Match – TTI & Quality
This table shows that device-matched inventory is generally above average quality (although again, device inventory only made up 7% of the network’s total attributed installs). With the device-matched inventory, installs past the 80th percentile drop below the average quality (24 days). There is some room to narrow the attribution window for device matches, as the quality appears to decrease with longer TTI.
Probabilistic Match – TTI & Quality
Probabilistic** matches here show the opposite trend: The faster the install, the poorer the quality. In summary, the probabilistic** matches tend to be low quality and unreasonably fast.
In one month, there were 54,000 attributed probabilistic-matched** installs from this network; 20,095 installs occurred in under 30 seconds (37% of networks total install volume); 10,000 occurred in under 10 seconds:
Network A Probabilistic Match – Install Volume By Time
Once we look at the network’s traffic by site IDs, we see that the percentage of traffic under 30 seconds varies:
We see here that all the attributed installs weren’t unreasonably fast–-only a portion were. In this case, these sites wouldn’t be flagged as MTTI outliers.
Conversely, we see instances where the quality for unreasonably fast installs tends to be on par with that of organic (unattributed) traffic. Here’s an example:
 Probabilistic Match — TTI & Quality
The installs again happened close to the reported click, but the quality was remarkably close to the average. The fastest 10% of installs occurred in under 13 seconds, and even the slowest installs (90th percentile) happened in under 3.5 minutes.
In this case, the questionable sites may have picked up a signal that an install was inbound, and the site essentially poached the organic traffic. This article details how that happens on Android traffic, but we have also seen it with device-match traffic sources for iOS.
Regardless, the time between the click and the event is unreasonably fast. It may warrant taking a closer look at the sites driving the installs and/or comparing TTI against your organic installs.
Flat/inverted install distribution
So far, we’ve looked at the click-to-install relationship outliers which appear unreasonably fast. Can the opposite be true, where the click-to-install relationship takes unreasonably long?
The graph below shows the click TTI distribution for a social app on iOS during the month of Dec. 16 through Jan. 17. Specifically, the chart details the time difference between the attributed click and the install for all networks during the period (27 networks, 2.7 million attributed installs):
Installs – All Networks
From this table, we infer that:
-
- 79% of installs occurred the same day as the click
- 11% likely installed the day after the click
- After 6 days, users were 0.70% as likely to install as they were on the day of the click
Overall, I would call this a typical distribution. The user sees an ad, becomes interested and takes action within a predictable time frame.
However, the following chart details a single site ID during the same time frame. This site ID was flagged because it showed an inordinate volume that, from a quality perspective, looked like unattributed (organic) traffic. This site accounted for 72,000 installs (approximately 3% of the total installs for this period):
Installs – Site_fh09
As you can see, the distribution is inverted: The user was 50% MORE likely to install 6 days after the click as they were on the day of.
While there is no smoking gun here, the delayed TTI is a red flag for two reasons:
1. If the goal of advertising is to create an inflection in behavior, the delay indicates that’s not happening, particularly when compared to other site IDs. Marketers shouldn’t be serving ads on those sites.
2. This sub-publisher may be timing injected clicks to game attribution either by sniping installs or stuffing clicks. The publisher is flooding the advertising space with clicks to lay claim to organic installs or installs actually driven by other networks.
What should you do?
MTTI is part of the Fraud Console, and repeat offenders across multiple apps are flagged, blocklisted and excluded from future campaigns.
TTI intra-site is also included in the Fraud Console. We’re currently working to understand what percentage of a site’s traffic under a reasonable time threshold warrants blocklisting.
For a flat or inverted install distribution, we’re currently building this into the Fraud Console.
What this all boils down to is how to make sense of our fraud reports. Our algorithms identify a normal distribution for your app and flag the outliers for you to analyze more closely. We’re providing a closer look into click-to-install behavior so that you can have an informed conversation with a network should they contain suspicious installs.
In case you missed them, read also Parts 1, 2, 4 and 5 of the Fraud Abatement Series.
**Please see iOS 14+ restrictions on probabilistic attribution here.
About the Author
Grant Simmons is the Director of Client Analytics at Kochava and leads the team in analyzing campaign performance and business value assessments. He is the former head of Retail Analytics at Oracle Data Cloud where he worked with over 1,500 retail directors, VPs, CMOs and agencies to develop individualized test-and-learn strategies.
For more information about the Kochava Fraud Console, Contact Us.