A recap of the webinar “All About the Money: The Future of Fintech & Finance Apps.”
The fintech industry is predicted to grow at a CAGR of 20.5% to $699.50 billion by 2030, up from $110.59 billion in 2020. A significant part of this accelerated growth is due to the COVID-19 pandemic. Over the past few years, the consumer’s need for fewer and fewer physical touchpoints has dramatically increased. This has driven the market to innovate new financial services to meet those needs.
Liftoff, in partnership with Kochava, brought together a panel of experts for the webinar “All About the Money: The Future of Finance & Fintech Apps” to discuss recent finance app trends and the latest best practices. These industry experts tackled topics including:
- Differences in user behavior by category
- Recent trends in user acquisition
- Ad creative trends and best practices for finance apps
- Highlights from the 2022 Finance Apps Report by Liftoff
You can watch the webinar here.
Now, let’s break down the topics our panelists discussed.
2022 Finance Apps Report
Liftoff provides a free annual downloadable report that serves as an educational guide for marketers during crucial junctures for fintech and finance companies. The report includes key indicators based on global data from June 2021-June 2022. The following conclusions are based on data from over 180 billion impressions, 2 billion clicks, and 16+ million installations.
The report’s key findings found that:
- In general, finance app downloads are up 20% yearly.
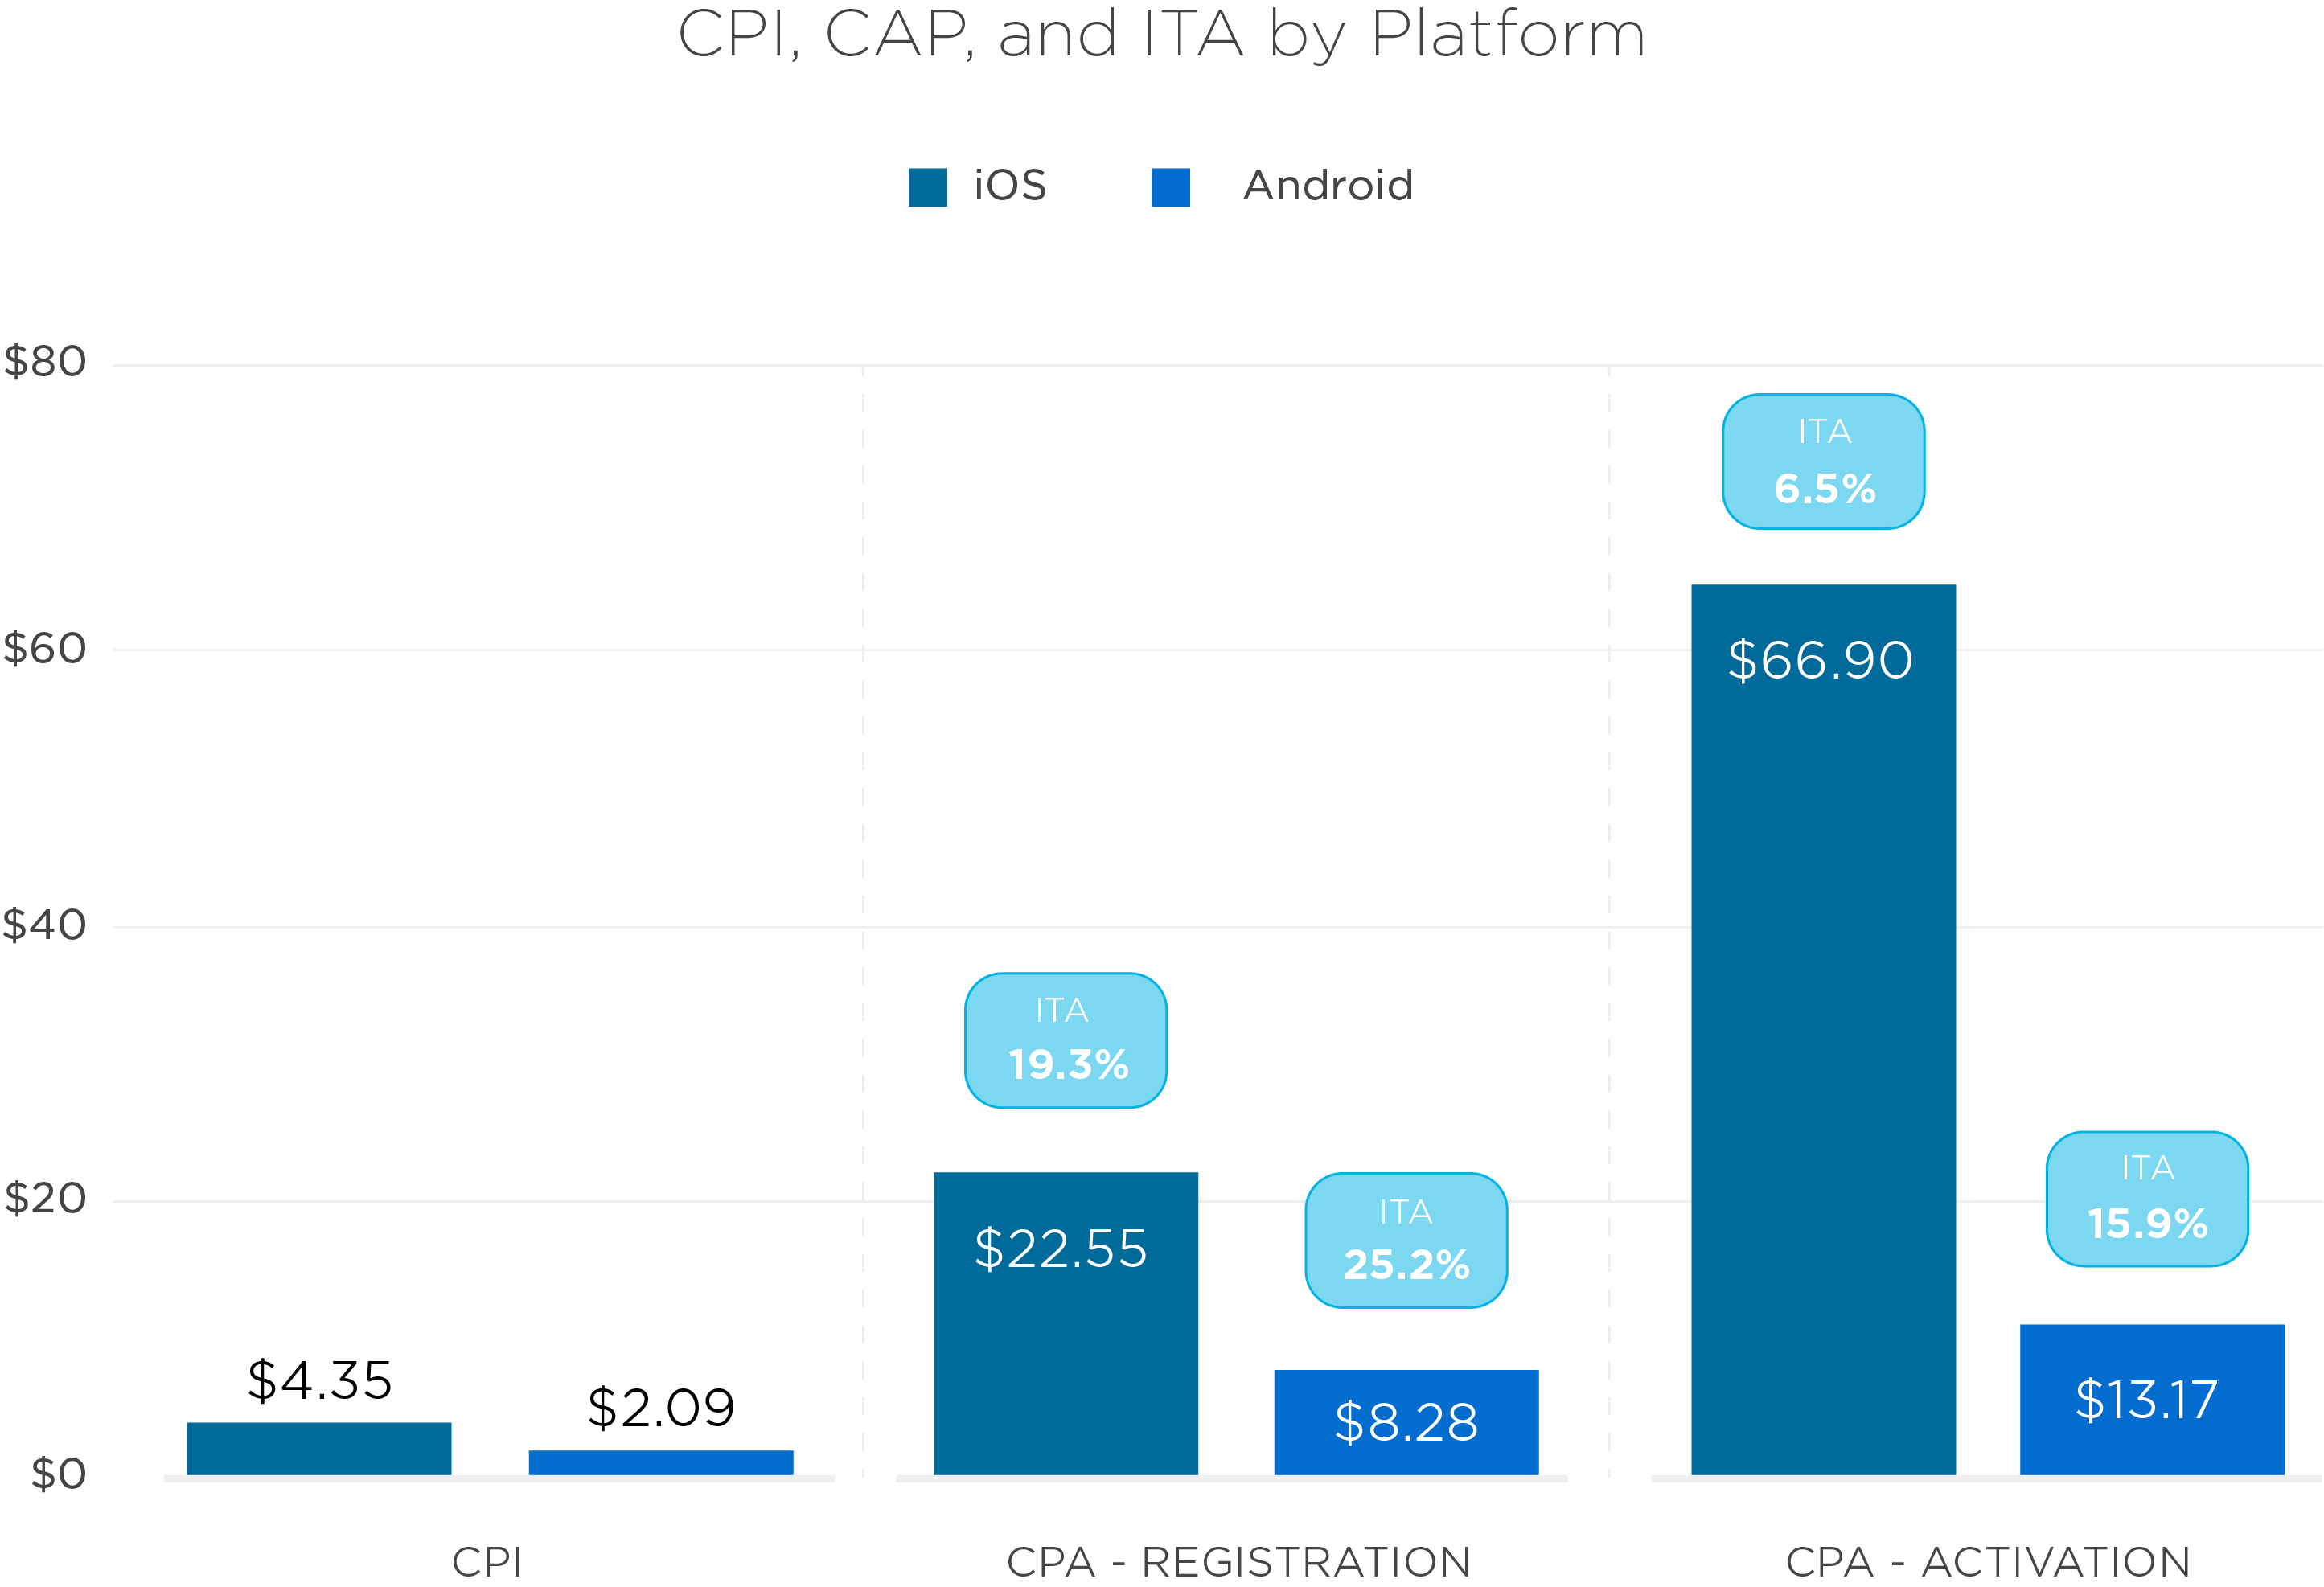
- Android users are over 2x as likely to activate their account (15.9% compared to 6.5% on iOS).
- Fintech users register at higher costs (17.96%) but activate at much higher rates (56.3%).
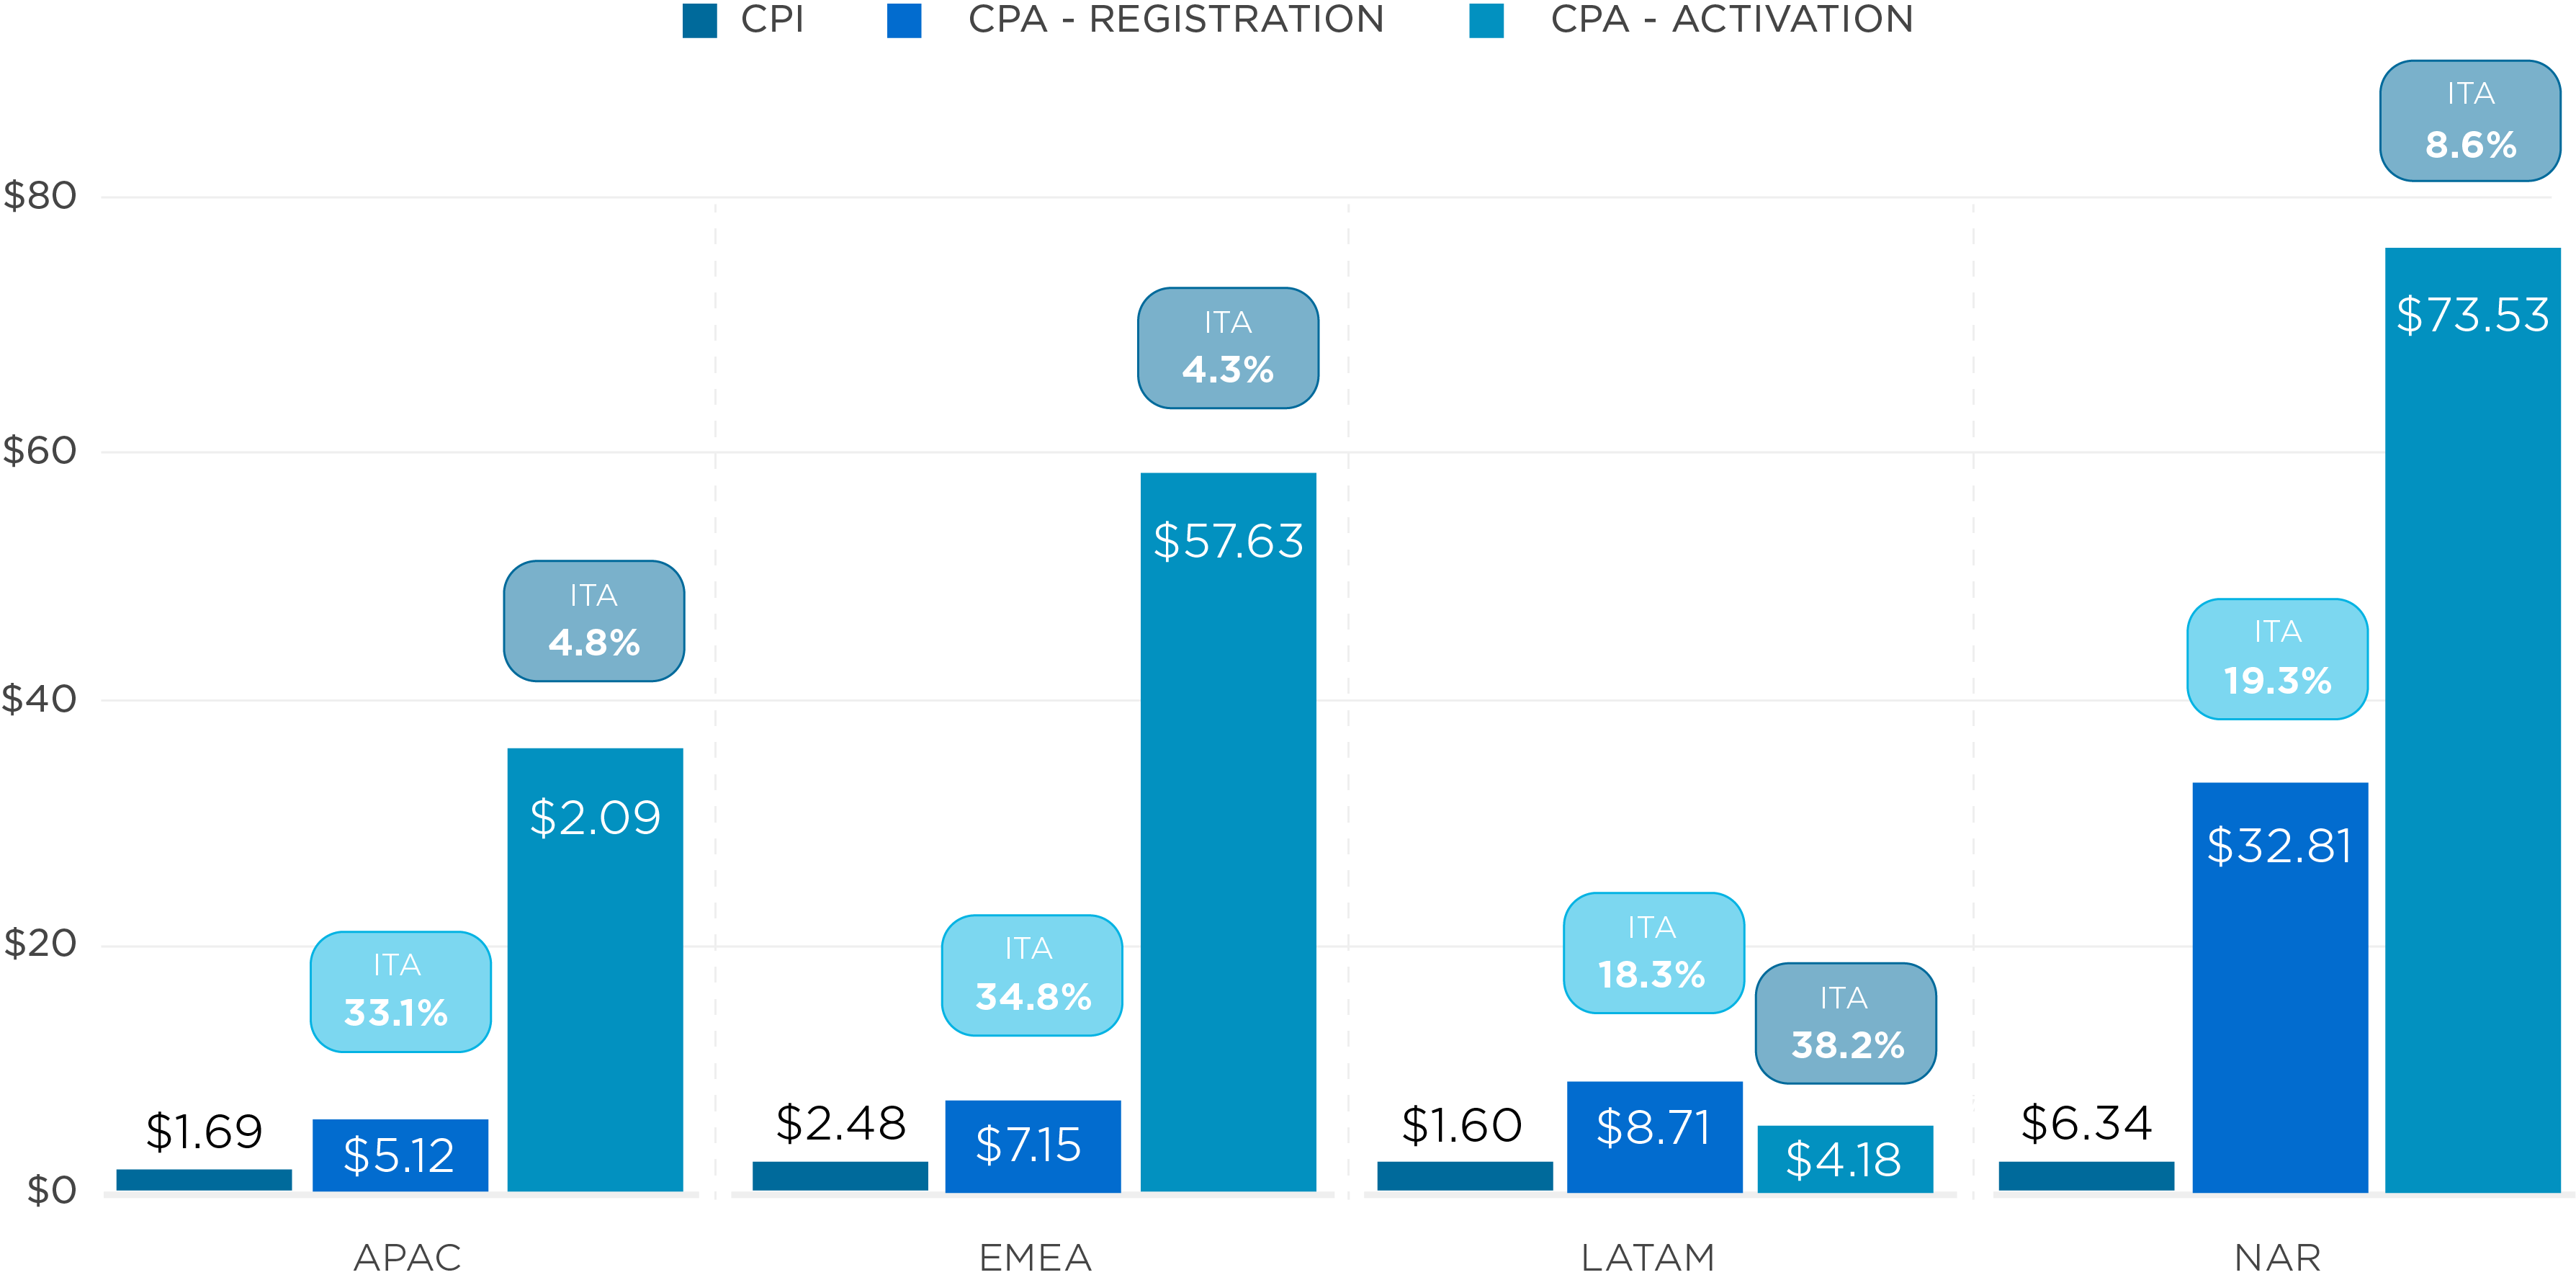
- LATAM users are more cost-effective to acquire ($1.60), but they also register at low rates (18.3%). EMEA users register on apps the most (34.8%).
Cost per install (CPI) has steadily declined since June, falling to $1.83 in April of this year.
iOS vs. Android & SKAdNetwork
The higher activation rate contradicts the popular belief that Android users are lower quality.
Why is that?
While Android users are less expensive to acquire in terms of CPI, this conversion rate demonstrates the difficulties in attributing down-funnel conversion events in iOS. To start, Apple’s SKAdNetwork makes tracking tough for marketers. Small businesses, in particular, frequently opt not to market their fintech apps on iOS because of scalability issues. Due to their size, they do not often fulfill SKAdNetworks privacy threshold standards and therefore have difficulty receiving adequate postback and conversion data. Unfortunately, marketers often lose two important things with SKAdNetwork, data granularity and time. It may require a team to decode the data from Apple before a marketer is able to evaluate and digest the results of their campaign, during which valuable time is lost. Data granularity also becomes an issue with new privacy thresholds, mainly with smaller companies, as mentioned above.
Companies introducing their first app can also bear disproportionate penalties. Recently, a significant amount of ad spend has migrated from traditional media partners like Facebook, Google, and Twitter to Apple Search Ads (ASA) instead. The market share for ASA is well over 30% for attributed installs on iOS. Android’s more affordable software and global footprint in emerging markets fulfill an essential goal for fintech apps: accessibility to the masses. The disparity in cost and global scope of iOS vs. Android software factor into the discrepancies in activation rates among app users. As a result, with Android, fintech apps can thrive in locations where traditional banking practices are limited.
This fast-paced environment makes the need for a mobile measurement partner (MMP) crucial. Kochava offers guidance through better insights and actionable data in one operational platform, making it so you don’t have to navigate SKAdNetwork or ASA alone.
SKAdNetwork is here to stay
The future of SKAdNetwork is bright! Here are a few things finance marketers/advertisers should consider as the latest iteration approaches.
SKAdNetwork is becoming a better option. While, at first glance, the privacy-centric API is intimidating, it won’t stay that way. With 4v, here are a few features marketers can look forward to:
- Web-to-app support, whereas previously only app-to-app was offered. This means that advertisers will be able to attribute web-based advertising that links to the App Store page for their relevant app.
- 3 postback conversions, compared to the current one postback. Each postback is based on a different conversion window (0-2 days, 3-7 days, and 8-35 days). Each window can contain several engagements, such as source ID, source app ID, and coarse-grained values. However, these are conditional and only included in second and third postbacks when privacy thresholds are met.
- A multi-tiered approach to privacy thresholds as opposed to the current one-size-fits-all. Advertisers will be able to receive data at a level that corresponds with the number of installs their campaigns generate, combined with both coarse & fine-grained conversion values, while still affording privacy to consumers. As campaigns meet higher privacy thresholds, more attribution insights will become available.
To ensure a smooth transition, it’s crucial that development teams are aware of and ready for the upcoming changes. It’s important to note that while SDK upgrades might be difficult, once SKAdNetwork support is implemented, it’s typically code-free and handled server-side with your preferred MMP. When updating conversion models, there may be a slight delay in data feedback. Following the implementation, you might initially receive data from the previous model.
Please contact your MMP for necessary SDK updates and any concerns about data delay.
Pro tip!
As the privacy-first ecosystem evolves, it’s a good idea to enlist the collaboration of cross-functional stakeholders from analytics and legal. This measure can help ensure that the data pipelines are flowing appropriately and that you are functioning within the existing legal boundaries for finance.
Regional differences
When it comes to EMEA, privacy concerns are at an all-time high. In addition to the GDPR, each country may have its own privacy rules and/or financial regulations that impact what finance apps can and cannot do in their marketing practices. Companies in that region frequently operate internationally, creating the need for a well-crafted strategy to adapt to nuances across countries and regions. .
How does this affect global activation?
Activation varies across markets because of the unique privacy requirements and regulations. The onboarding process can vary, and in some cases, in-person identity verification may be a requirement to fulfill activation – adding friction that impedes overall install-to-activation rates. Key performance indicators also change from market to market, depending on the client and onboarding process.
Given all of the variations, Kochava noted that some of the brands it serves have completely separate apps for different regions and/or countries to more simply manage the user experience. Whereas other brands manage it all under one global app. Due to implications for development teams and product managers, the approach a brand takes should be decided with extensive consultation.
Creative differences
According to the Liftoff finance report, highlighting the user interface (UI) of applications, including features and offers, was more appealing to consumers than lifestyle imagery.
Are we leaving traditional practices behind?
In short, no, not really.
Because there is less data to work with, being precise with the placement of lifestyle messages inside the funnel has become more important. When using more traditional types of prospecting, such as TV advertisements or Facebook, it’s critical to focus on motive value propositions. Customer research and feedback are key to success here. Tally, a US-based credit card debt consolidation company, said research found that their users’ most scarce resource is the belief that progress is possible. Because of this finding, they’ve begun reorienting their brand messaging to encourage their customers that progress is possible. While this messaging is largely qualitative, their customer base has responded more positively to it than to previous messaging and, through this method, has found quantifiable success in the form of installs, activations, and such.
Television is no longer just an upper funnel channel. Connected TV (CTV) is another successful avenue that is less often utilized by marketers because of its perceived barrier to entry. In general, television advertisements provide their own set of unique technological hurdles. Throw in finding placement and data only increases the difficulty. However, when done correctly, it produces very profitable results especially compared to traditional search campaigns. QR codes are another new-ish direct response technique that allows advertisers to connect with their customer base through ads with fewer touchpoints, typically resulting in high conversion rates.
Types of fintech apps
The Liftoff report breaks these apps into 3 categories: banking, fintech, and investing. Given the scope of finance, the panelists further developed them into the following categories, taking event measurement strategy into consideration.
- Money transfer
- Crypto
- Insurance
- Online banking
- Personal loans
- Credit Management
- Investing
- Tax services
- Budget Management
Looking to Q4
What will spend patterns look like in Q4/post Q4?
Tally takes a different approach to Q4 than other companies. The fintech app opts not to compete with advertising companies throughout the holiday season because of their primary service, credit card debt consolidation. Instead, they position themselves to increase marketing expenditure and campaigns just after the post-holiday season peak, when consumers are more likely to engage in their services. At that time, CPM, CPI, and CPAs, essential to campaign operations, become considerably more affordable as their target audience has a greater need for their services, and the market is less saturated with advertisements.
For Kochava, the strategy is dependent on the sub-vertical leading up to and following Q4. As an example, for a seasonal app (e.g., tax services), one of the most important aims is measuring the re-acquisition of last season’s customers while also continuing to drive new user acquisition. For this reason, Kochava offers configurable install deduplication and reprocessing. For brands that never want to pay twice to acquire the same user, install deduplication can be set to lifetime. However, for brands that want to re-attribute installs and pay CPI again, install reprocessing can be set to a window of their choosing. Learn more about Kochava install deduplication here.
Got questions? We’ve got answers.
For more information, visit our website or reach us at support@kochava.com. For more information on Liftoff Mobile, visit their website or email them at info@liftoff.io.
Stay up-to-date with all the latest in adtech by subscribing to our newsletter.